|
Download Data (XLS File) |
|
||||||||
|
||||||||
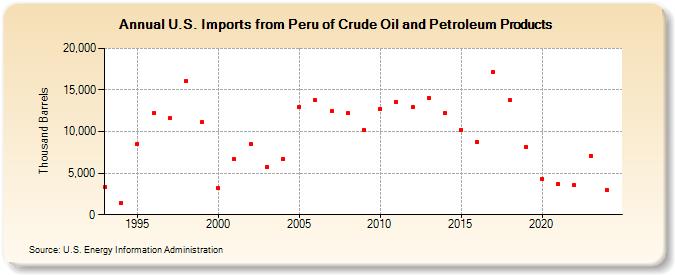
| U.S. Imports from Peru of Crude Oil and Petroleum Products (Thousand Barrels) | ||||||||
| Decade | Year-0 | Year-1 | Year-2 | Year-3 | Year-4 | Year-5 | Year-6 | Year-7 | Year-8 | Year-9 |
|---|---|---|---|---|---|---|---|---|---|---|
| 1990's | 3,297 | 1,462 | 8,530 | 12,256 | 11,596 | 16,060 | 11,117 | |||
| 2000's | 3,190 | 6,675 | 8,454 | 5,730 | 6,672 | 12,924 | 13,737 | 12,427 | 12,172 | 10,203 |
| 2010's | 12,750 | 13,603 | 12,934 | 14,056 | 12,176 | 10,161 | 8,736 | 17,177 | 13,756 | 8,178 |
| 2020's | 4,331 | 3,715 | 3,530 | 7,101 |
| - = No Data Reported; -- = Not Applicable; NA = Not Available; W = Withheld to avoid disclosure of individual company data. |
| Release Date: 6/28/2024 |
| Next Release Date: 8/30/2024 |