|
Download Data (XLS File) |
|
||||||||
|
||||||||
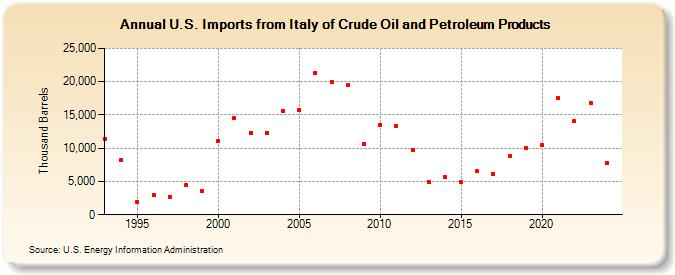
| U.S. Imports from Italy of Crude Oil and Petroleum Products (Thousand Barrels) | ||||||||
| Decade | Year-0 | Year-1 | Year-2 | Year-3 | Year-4 | Year-5 | Year-6 | Year-7 | Year-8 | Year-9 |
|---|---|---|---|---|---|---|---|---|---|---|
| 1990's | 11,429 | 8,194 | 1,864 | 2,977 | 2,695 | 4,473 | 3,580 | |||
| 2000's | 11,083 | 14,462 | 12,287 | 12,324 | 15,579 | 15,702 | 21,350 | 19,968 | 19,447 | 10,679 |
| 2010's | 13,530 | 13,379 | 9,796 | 4,924 | 5,665 | 4,925 | 6,509 | 6,110 | 8,762 | 10,030 |
| 2020's | 10,549 | 17,568 | 14,025 | 16,816 |
| - = No Data Reported; -- = Not Applicable; NA = Not Available; W = Withheld to avoid disclosure of individual company data. |
| Release Date: 3/29/2024 |
| Next Release Date: 8/30/2024 |