|
Download Data (XLS File) |
|
||||||||
|
||||||||
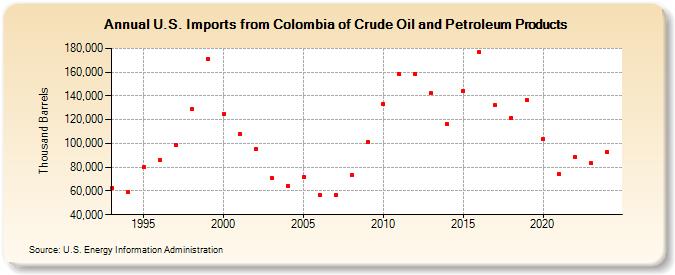
| U.S. Imports from Colombia of Crude Oil and Petroleum Products (Thousand Barrels) | ||||||||
| Decade | Year-0 | Year-1 | Year-2 | Year-3 | Year-4 | Year-5 | Year-6 | Year-7 | Year-8 | Year-9 |
|---|---|---|---|---|---|---|---|---|---|---|
| 1990's | 62,277 | 58,858 | 79,829 | 85,657 | 99,078 | 129,203 | 170,982 | |||
| 2000's | 125,049 | 107,896 | 95,058 | 71,073 | 64,413 | 71,532 | 56,532 | 56,487 | 73,312 | 100,867 |
| 2010's | 133,202 | 158,060 | 158,586 | 142,158 | 115,940 | 144,193 | 176,811 | 132,088 | 121,525 | 136,260 |
| 2020's | 103,865 | 74,185 | 88,358 | 83,234 |
| - = No Data Reported; -- = Not Applicable; NA = Not Available; W = Withheld to avoid disclosure of individual company data. |
| Release Date: 6/28/2024 |
| Next Release Date: 8/30/2024 |