|
Download Data (XLS File) |
|
||||||||
|
||||||||
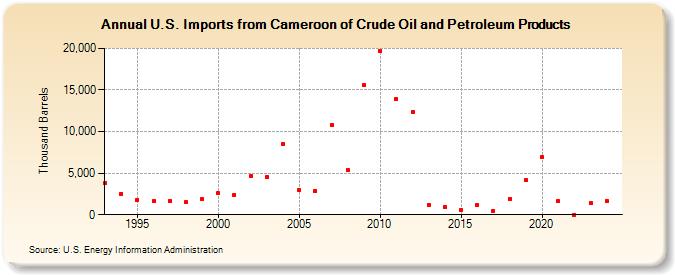
| U.S. Imports from Cameroon of Crude Oil and Petroleum Products (Thousand Barrels) | ||||||||
| Decade | Year-0 | Year-1 | Year-2 | Year-3 | Year-4 | Year-5 | Year-6 | Year-7 | Year-8 | Year-9 |
|---|---|---|---|---|---|---|---|---|---|---|
| 1990's | 3,755 | 2,526 | 1,807 | 1,669 | 1,675 | 1,471 | 1,885 | |||
| 2000's | 2,562 | 2,419 | 4,681 | 4,499 | 8,548 | 2,923 | 2,857 | 10,804 | 5,341 | 15,585 |
| 2010's | 19,728 | 13,921 | 12,356 | 1,225 | 933 | 580 | 1,196 | 477 | 1,935 | 4,167 |
| 2020's | 6,958 | 1,600 | 1 | 1,379 |
| - = No Data Reported; -- = Not Applicable; NA = Not Available; W = Withheld to avoid disclosure of individual company data. |
| Release Date: 6/28/2024 |
| Next Release Date: 8/30/2024 |