|
Download Data (XLS File) |
|
||||||||
|
||||||||
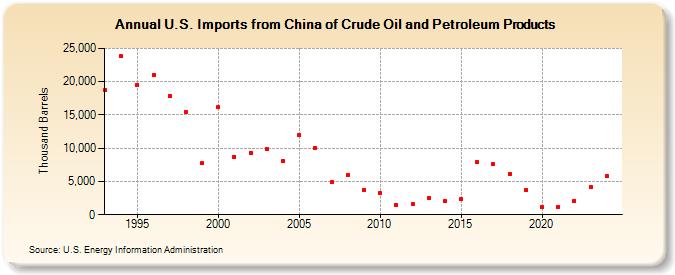
| U.S. Imports from China of Crude Oil and Petroleum Products (Thousand Barrels) | ||||||||
| Decade | Year-0 | Year-1 | Year-2 | Year-3 | Year-4 | Year-5 | Year-6 | Year-7 | Year-8 | Year-9 |
|---|---|---|---|---|---|---|---|---|---|---|
| 1990's | 18,715 | 23,848 | 19,462 | 21,030 | 17,844 | 15,505 | 7,699 | |||
| 2000's | 16,141 | 8,735 | 9,329 | 9,869 | 8,138 | 11,940 | 10,059 | 4,892 | 5,944 | 3,771 |
| 2010's | 3,230 | 1,468 | 1,555 | 2,457 | 2,088 | 2,287 | 7,855 | 7,577 | 6,169 | 3,722 |
| 2020's | 1,148 | 1,229 | 2,108 | 4,174 |
| - = No Data Reported; -- = Not Applicable; NA = Not Available; W = Withheld to avoid disclosure of individual company data. |
| Release Date: 6/28/2024 |
| Next Release Date: 8/30/2024 |