|
Download Data (XLS File) |
|
||||||||
|
||||||||
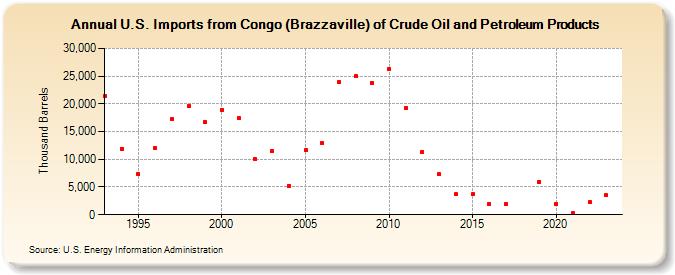
| U.S. Imports from Congo (Brazzaville) of Crude Oil and Petroleum Products (Thousand Barrels) | ||||||||
| Decade | Year-0 | Year-1 | Year-2 | Year-3 | Year-4 | Year-5 | Year-6 | Year-7 | Year-8 | Year-9 |
|---|---|---|---|---|---|---|---|---|---|---|
| 1990's | 21,392 | 11,899 | 7,316 | 11,963 | 17,178 | 19,527 | 16,645 | |||
| 2000's | 18,950 | 17,430 | 10,044 | 11,455 | 5,246 | 11,592 | 12,957 | 23,849 | 24,943 | 23,816 |
| 2010's | 26,276 | 19,275 | 11,341 | 7,293 | 3,675 | 3,661 | 1,925 | 1,875 | 5,986 | |
| 2020's | 1,902 | 271 | 2,233 | 3,472 |
| - = No Data Reported; -- = Not Applicable; NA = Not Available; W = Withheld to avoid disclosure of individual company data. |
| Release Date: 6/28/2024 |
| Next Release Date: 8/30/2024 |