|
Download Data (XLS File) |
|
||||||||
|
||||||||
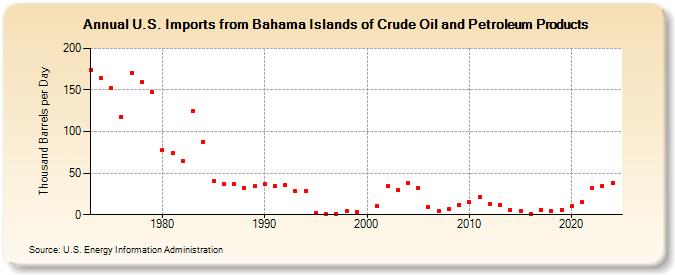
| U.S. Imports from Bahama Islands of Crude Oil and Petroleum Products (Thousand Barrels per Day) | ||||||||
| Decade | Year-0 | Year-1 | Year-2 | Year-3 | Year-4 | Year-5 | Year-6 | Year-7 | Year-8 | Year-9 |
|---|---|---|---|---|---|---|---|---|---|---|
| 1970's | 174 | 164 | 152 | 118 | 171 | 160 | 147 | |||
| 1980's | 78 | 74 | 65 | 125 | 88 | 40 | 37 | 37 | 32 | 34 |
| 1990's | 37 | 35 | 36 | 28 | 29 | 2 | 1 | 1 | 4 | 3 |
| 2000's | 10 | 34 | 30 | 38 | 32 | 9 | 4 | 7 | 12 | |
| 2010's | 15 | 21 | 13 | 12 | 6 | 5 | 1 | 6 | 4 | 6 |
| 2020's | 10 | 15 | 32 | 35 |
| - = No Data Reported; -- = Not Applicable; NA = Not Available; W = Withheld to avoid disclosure of individual company data. |
| Release Date: 3/29/2024 |
| Next Release Date: 8/30/2024 |