|
Download Data (XLS File) |
|
||||||||
|
||||||||
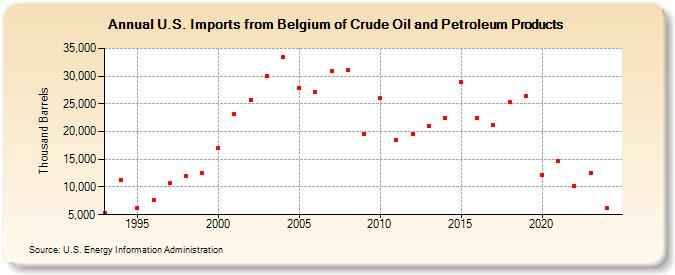
| U.S. Imports from Belgium of Crude Oil and Petroleum Products (Thousand Barrels) | ||||||||
| Decade | Year-0 | Year-1 | Year-2 | Year-3 | Year-4 | Year-5 | Year-6 | Year-7 | Year-8 | Year-9 |
|---|---|---|---|---|---|---|---|---|---|---|
| 1990's | 5,310 | 11,238 | 6,281 | 7,654 | 10,661 | 11,927 | 12,542 | |||
| 2000's | 16,962 | 23,141 | 25,781 | 29,936 | 33,377 | 27,941 | 27,107 | 30,902 | 31,151 | 19,581 |
| 2010's | 26,062 | 18,551 | 19,553 | 21,078 | 22,446 | 28,940 | 22,472 | 21,166 | 25,266 | 26,330 |
| 2020's | 12,151 | 14,663 | 10,240 | 12,553 |
| - = No Data Reported; -- = Not Applicable; NA = Not Available; W = Withheld to avoid disclosure of individual company data. |
| Release Date: 6/28/2024 |
| Next Release Date: 8/30/2024 |