|
Download Data (XLS File) |
|
||||||||
|
||||||||
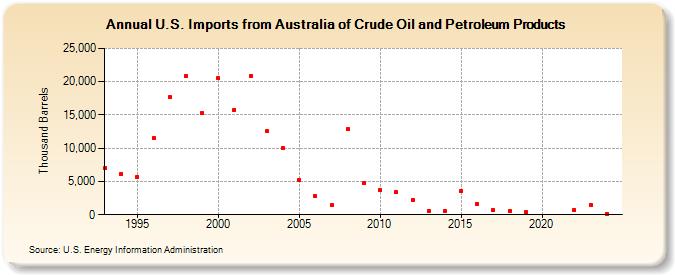
| U.S. Imports from Australia of Crude Oil and Petroleum Products (Thousand Barrels) | ||||||||
| Decade | Year-0 | Year-1 | Year-2 | Year-3 | Year-4 | Year-5 | Year-6 | Year-7 | Year-8 | Year-9 |
|---|---|---|---|---|---|---|---|---|---|---|
| 1990's | 6,993 | 6,154 | 5,729 | 11,500 | 17,621 | 20,815 | 15,287 | |||
| 2000's | 20,485 | 15,750 | 20,890 | 12,523 | 10,029 | 5,213 | 2,774 | 1,389 | 12,880 | 4,699 |
| 2010's | 3,706 | 3,376 | 2,238 | 606 | 578 | 3,635 | 1,620 | 648 | 529 | 398 |
| 2020's | 700 | 1,464 |
| - = No Data Reported; -- = Not Applicable; NA = Not Available; W = Withheld to avoid disclosure of individual company data. |
| Release Date: 8/30/2024 |
| Next Release Date: 8/29/2025 |