|
Download Data (XLS File) |
|
||||||||
|
||||||||
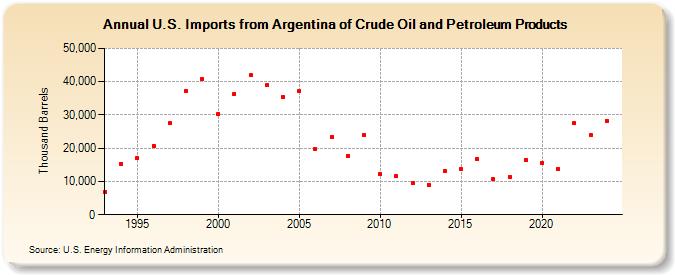
| U.S. Imports from Argentina of Crude Oil and Petroleum Products (Thousand Barrels) | ||||||||
| Decade | Year-0 | Year-1 | Year-2 | Year-3 | Year-4 | Year-5 | Year-6 | Year-7 | Year-8 | Year-9 |
|---|---|---|---|---|---|---|---|---|---|---|
| 1990's | 6,914 | 15,392 | 17,088 | 20,751 | 27,525 | 37,243 | 40,801 | |||
| 2000's | 30,268 | 36,313 | 41,953 | 38,898 | 35,536 | 37,065 | 19,800 | 23,510 | 17,665 | 23,921 |
| 2010's | 12,224 | 11,522 | 9,584 | 9,068 | 13,227 | 13,681 | 16,798 | 10,597 | 11,462 | 16,587 |
| 2020's | 15,671 | 13,836 | 27,566 | 23,598 |
| - = No Data Reported; -- = Not Applicable; NA = Not Available; W = Withheld to avoid disclosure of individual company data. |
| Release Date: 6/28/2024 |
| Next Release Date: 8/30/2024 |