|
Download Data (XLS File) |
|
||||||||
|
||||||||
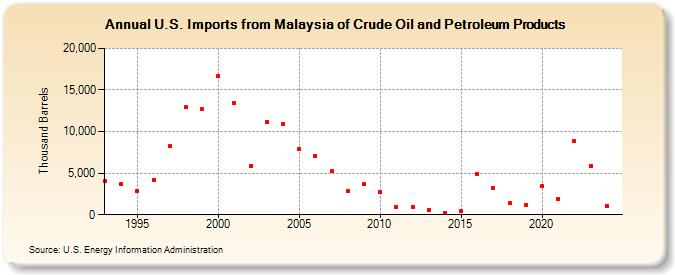
| U.S. Imports from Malaysia of Crude Oil and Petroleum Products (Thousand Barrels) | ||||||||
| Decade | Year-0 | Year-1 | Year-2 | Year-3 | Year-4 | Year-5 | Year-6 | Year-7 | Year-8 | Year-9 |
|---|---|---|---|---|---|---|---|---|---|---|
| 1990's | 4,113 | 3,656 | 2,845 | 4,198 | 8,214 | 12,932 | 12,663 | |||
| 2000's | 16,648 | 13,433 | 5,893 | 11,152 | 10,875 | 7,849 | 7,110 | 5,207 | 2,806 | 3,659 |
| 2010's | 2,782 | 922 | 959 | 570 | 224 | 411 | 4,908 | 3,258 | 1,453 | 1,156 |
| 2020's | 3,473 | 1,898 | 8,825 | 5,895 |
| - = No Data Reported; -- = Not Applicable; NA = Not Available; W = Withheld to avoid disclosure of individual company data. |
| Release Date: 3/29/2024 |
| Next Release Date: 8/30/2024 |