|
Download Data (XLS File) |
|
||||||||
|
||||||||
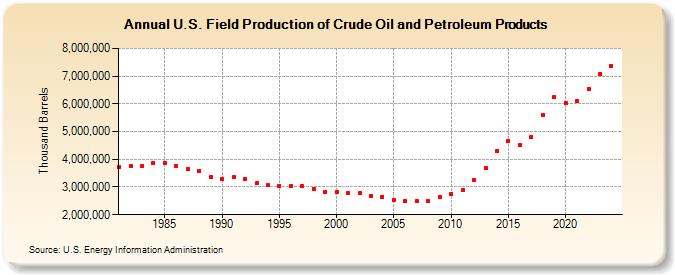
| U.S. Field Production of Crude Oil and Petroleum Products (Thousand Barrels) | ||||||||
| Decade | Year-0 | Year-1 | Year-2 | Year-3 | Year-4 | Year-5 | Year-6 | Year-7 | Year-8 | Year-9 |
|---|---|---|---|---|---|---|---|---|---|---|
| 1980's | 3,734,115 | 3,741,822 | 3,759,182 | 3,862,759 | 3,882,008 | 3,755,375 | 3,652,989 | 3,593,355 | 3,364,889 | |
| 1990's | 3,282,939 | 3,346,228 | 3,292,622 | 3,132,551 | 3,061,676 | 3,037,467 | 3,035,837 | 3,018,097 | 2,924,121 | 2,821,852 |
| 2000's | 2,830,122 | 2,799,475 | 2,782,876 | 2,689,505 | 2,653,545 | 2,518,798 | 2,490,994 | 2,502,768 | 2,482,702 | 2,652,318 |
| 2010's | 2,758,824 | 2,879,950 | 3,269,006 | 3,686,878 | 4,308,941 | 4,665,342 | 4,522,152 | 4,796,150 | 5,591,993 | 6,254,489 |
| 2020's | 6,036,398 | 6,092,806 | 6,512,944 | 7,065,717 |
| - = No Data Reported; -- = Not Applicable; NA = Not Available; W = Withheld to avoid disclosure of individual company data. |
| Release Date: 4/30/2024 |
| Next Release Date: 8/30/2024 |