|
Download Data (XLS File) |
|
||||||||
|
||||||||
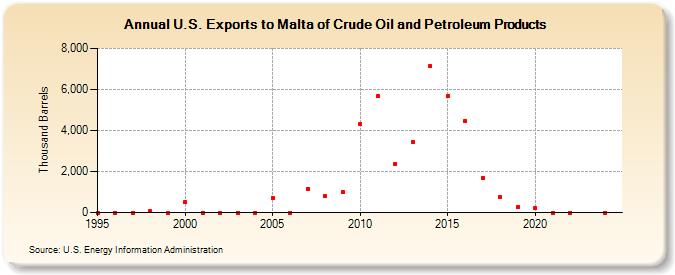
| U.S. Exports to Malta of Crude Oil and Petroleum Products (Thousand Barrels) | ||||||||
| Decade | Year-0 | Year-1 | Year-2 | Year-3 | Year-4 | Year-5 | Year-6 | Year-7 | Year-8 | Year-9 |
|---|---|---|---|---|---|---|---|---|---|---|
| 1990's | 0 | 0 | 2 | 54 | 1 | |||||
| 2000's | 517 | 0 | 0 | 0 | 0 | 728 | 0 | 1,172 | 785 | 990 |
| 2010's | 4,329 | 5,662 | 2,389 | 3,426 | 7,153 | 5,684 | 4,462 | 1,682 | 737 | 274 |
| 2020's | 217 | 1 | 1 |
| - = No Data Reported; -- = Not Applicable; NA = Not Available; W = Withheld to avoid disclosure of individual company data. |
| Release Date: 3/29/2024 |
| Next Release Date: 8/30/2024 |