|
Download Data (XLS File) |
|
||||||||
|
||||||||
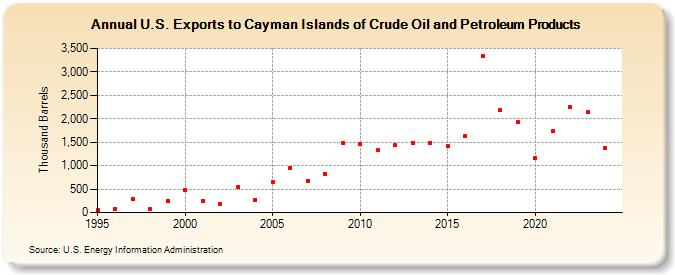
| U.S. Exports to Cayman Islands of Crude Oil and Petroleum Products (Thousand Barrels) | ||||||||
| Decade | Year-0 | Year-1 | Year-2 | Year-3 | Year-4 | Year-5 | Year-6 | Year-7 | Year-8 | Year-9 |
|---|---|---|---|---|---|---|---|---|---|---|
| 1990's | 44 | 69 | 285 | 80 | 248 | |||||
| 2000's | 483 | 257 | 185 | 535 | 274 | 661 | 945 | 680 | 822 | 1,473 |
| 2010's | 1,455 | 1,328 | 1,434 | 1,485 | 1,483 | 1,417 | 1,631 | 3,332 | 2,176 | 1,935 |
| 2020's | 1,165 | 1,742 | 2,246 | 1,869 |
| - = No Data Reported; -- = Not Applicable; NA = Not Available; W = Withheld to avoid disclosure of individual company data. |
| Release Date: 3/29/2024 |
| Next Release Date: 8/30/2024 |