|
Download Data (XLS File) |
|
||||||||
|
||||||||
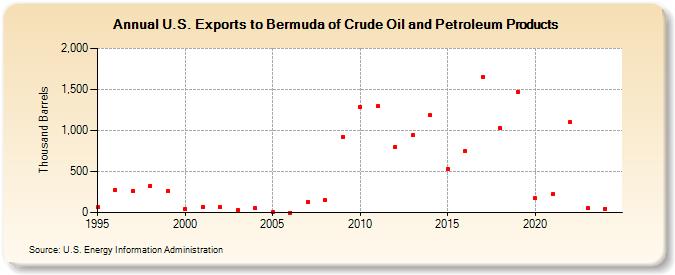
| U.S. Exports to Bermuda of Crude Oil and Petroleum Products (Thousand Barrels) | ||||||||
| Decade | Year-0 | Year-1 | Year-2 | Year-3 | Year-4 | Year-5 | Year-6 | Year-7 | Year-8 | Year-9 |
|---|---|---|---|---|---|---|---|---|---|---|
| 1990's | 64 | 274 | 260 | 329 | 257 | |||||
| 2000's | 43 | 70 | 70 | 34 | 54 | 1 | 0 | 130 | 147 | 922 |
| 2010's | 1,287 | 1,293 | 803 | 944 | 1,183 | 530 | 748 | 1,654 | 1,025 | 1,471 |
| 2020's | 172 | 224 | 1,098 | 52 |
| - = No Data Reported; -- = Not Applicable; NA = Not Available; W = Withheld to avoid disclosure of individual company data. |
| Release Date: 8/30/2024 |
| Next Release Date: 8/29/2025 |