|
Download Data (XLS File) |
|
||||||||
|
||||||||
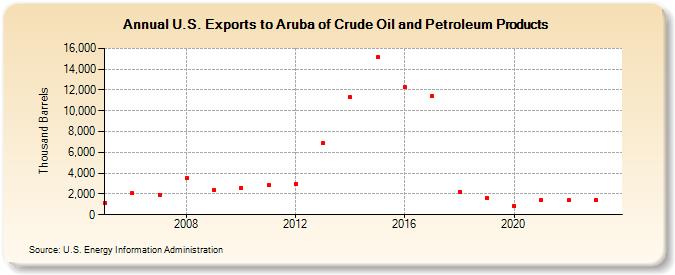
| U.S. Exports to Aruba of Crude Oil and Petroleum Products (Thousand Barrels) | ||||||||
| Decade | Year-0 | Year-1 | Year-2 | Year-3 | Year-4 | Year-5 | Year-6 | Year-7 | Year-8 | Year-9 |
|---|---|---|---|---|---|---|---|---|---|---|
| 2000's | 1,129 | 2,055 | 1,931 | 3,542 | 2,410 | |||||
| 2010's | 2,578 | 2,835 | 2,969 | 6,871 | 11,302 | 15,132 | 12,256 | 11,392 | 2,229 | 1,652 |
| 2020's | 835 | 1,393 | 1,371 | 1,436 | 1,703 |
| - = No Data Reported; -- = Not Applicable; NA = Not Available; W = Withheld to avoid disclosure of individual company data. |
| Release Date: 6/30/2025 |
| Next Release Date: 8/29/2025 |