|
Download Data (XLS File) |
|
||||||||
|
||||||||
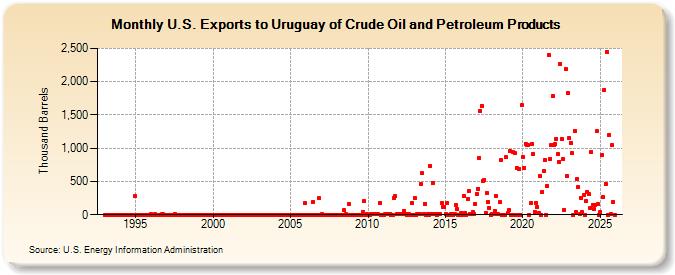
| U.S. Exports to Uruguay of Crude Oil and Petroleum Products (Thousand Barrels) | ||||||||
| Year | Jan | Feb | Mar | Apr | May | Jun | Jul | Aug | Sep | Oct | Nov | Dec |
|---|---|---|---|---|---|---|---|---|---|---|---|---|
| 1993 | 1 | 3 | 2 | 2 | 1 | 0 | 1 | 2 | 1 | 1 | 1 | 1 |
| 1994 | 0 | 0 | 0 | 1 | 1 | 1 | 1 | 2 | 1 | 1 | 1 | 276 |
| 1995 | 2 | 0 | 1 | 1 | 2 | 1 | 2 | 1 | 1 | 1 | 1 | 1 |
| 1996 | 8 | 1 | 2 | 6 | 3 | 2 | 1 | 1 | 5 | 7 | 3 | 1 |
| 1997 | 1 | 1 | 1 | 1 | 2 | 1 | 17 | 2 | 2 | 1 | 3 | 3 |
| 1998 | 1 | 2 | 2 | 2 | 1 | 1 | 1 | 1 | 0 | 0 | 1 | 3 |
| 1999 | 0 | 1 | 1 | 1 | 2 | 1 | 1 | 2 | 1 | 2 | 2 | 1 |
| 2000 | 0 | 0 | 0 | 1 | 0 | 0 | 0 | 1 | 1 | 1 | 0 | 1 |
| 2001 | 1 | 1 | 1 | 2 | 1 | 0 | 0 | 0 | 0 | 1 | 0 | 0 |
| 2002 | 0 | 0 | 1 | 1 | 1 | 0 | 1 | 1 | 0 | 1 | 2 | 1 |
| 2003 | 1 | 1 | 1 | 1 | 1 | 1 | 1 | 1 | 0 | 0 | 0 | 0 |
| 2004 | 0 | 1 | 2 | 1 | 1 | 1 | 0 | 1 | 1 | 1 | 1 | 1 |
| 2005 | 1 | 0 | 0 | 0 | 1 | 0 | 0 | 1 | 0 | 0 | 0 | 169 |
| 2006 | 1 | 0 | 0 | 0 | 1 | 194 | 0 | 1 | 1 | 0 | 251 | 1 |
| 2007 | 7 | 0 | 0 | 1 | 1 | 1 | 0 | 1 | 0 | 1 | 1 | 1 |
| 2008 | 2 | 1 | 1 | 3 | 3 | 66 | 1 | 4 | 1 | 160 | 2 | 3 |
| 2009 | 2 | 1 | 1 | 1 | 1 | 2 | 2 | 2 | 47 | 201 | 2 | 4 |
| 2010 | 1 | 3 | 5 | 4 | 4 | 5 | 6 | 8 | 4 | 180 | 2 | 3 |
| 2011 | 3 | 5 | 18 | 4 | 7 | 8 | 3 | 3 | 253 | 285 | 5 | 17 |
| 2012 | 4 | 4 | 8 | 4 | 55 | 5 | 3 | 6 | 4 | 3 | 177 | 2 |
| 2013 | 255 | 3 | 4 | 7 | 7 | 468 | 623 | 5 | 166 | 3 | 8 | 3 |
| 2014 | 738 | 8 | 483 | 7 | 8 | 3 | 4 | 4 | 6 | 174 | 116 | 119 |
| 2015 | 6 | 177 | 3 | 3 | 17 | 16 | 3 | 4 | 142 | 84 | 2 | 3 |
| 2016 | 29 | 2 | 281 | 31 | 3 | 239 | 363 | 18 | 4 | 42 | 10 | 167 |
| 2017 | 308 | 392 | 853 | 1,556 | 1,640 | 506 | 525 | 32 | 327 | 192 | 108 | 3 |
| 2018 | 4 | 5 | 50 | 279 | 4 | 4 | 185 | 827 | 3 | 3 | 1 | 861 |
| 2019 | 20 | 64 | 951 | 3 | 947 | 2 | 924 | 708 | 2 | 690 | 2 | 1,644 |
| 2020 | 871 | 705 | 1,068 | 1,050 | 1,054 | 1 | 170 | 1,070 | 909 | 38 | 180 | 116 |
| 2021 | 20 | 582 | 2 | 348 | 660 | 826 | 1 | 429 | 2,408 | 842 | 1,043 | 1,786 |
| 2022 | 1,045 | 1,064 | 1,145 | 916 | 799 | 2,271 | 1,142 | 830 | 75 | 2,190 | 582 | 1,830 |
| 2023 | 1,150 | 1,078 | 924 | 2 | 1,265 | 40 | 539 | 418 | 4 | 249 | 40 | 289 |
| 2024 | 1 | |||||||||||
| - = No Data Reported; -- = Not Applicable; NA = Not Available; W = Withheld to avoid disclosure of individual company data. |
| Release Date: 3/29/2024 |
| Next Release Date: 4/30/2024 |