|
Download Data (XLS File) |
|
||||||||
|
||||||||
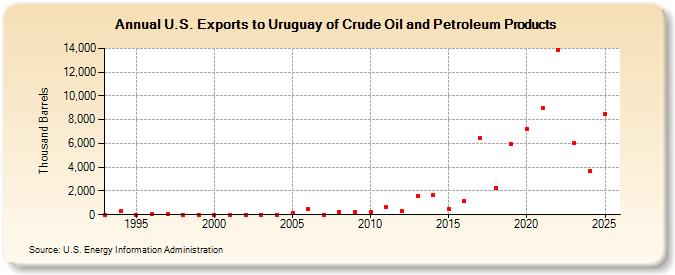
| U.S. Exports to Uruguay of Crude Oil and Petroleum Products (Thousand Barrels) | ||||||||
| Decade | Year-0 | Year-1 | Year-2 | Year-3 | Year-4 | Year-5 | Year-6 | Year-7 | Year-8 | Year-9 |
|---|---|---|---|---|---|---|---|---|---|---|
| 1990's | 15 | 286 | 14 | 40 | 35 | 14 | 15 | |||
| 2000's | 7 | 9 | 9 | 8 | 9 | 173 | 452 | 15 | 247 | 267 |
| 2010's | 226 | 612 | 276 | 1,552 | 1,669 | 462 | 1,189 | 6,442 | 2,228 | 5,958 |
| 2020's | 7,233 | 8,949 | 13,890 | 5,998 |
| - = No Data Reported; -- = Not Applicable; NA = Not Available; W = Withheld to avoid disclosure of individual company data. |
| Release Date: 3/29/2024 |
| Next Release Date: 8/30/2024 |