|
Download Data (XLS File) |
|
||||||||
|
||||||||
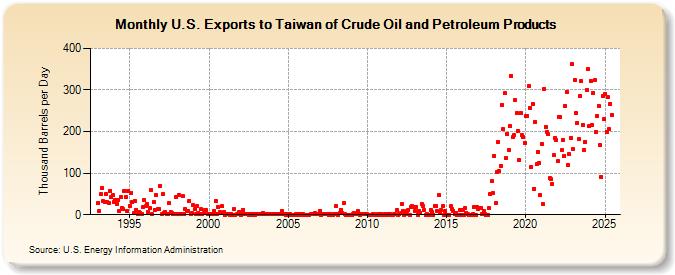
| U.S. Exports to Taiwan of Crude Oil and Petroleum Products (Thousand Barrels per Day) | ||||||||
| Year | Jan | Feb | Mar | Apr | May | Jun | Jul | Aug | Sep | Oct | Nov | Dec |
|---|---|---|---|---|---|---|---|---|---|---|---|---|
| 1993 | 28 | 10 | 49 | 64 | 32 | 30 | 51 | 30 | 29 | 58 | 42 | 48 |
| 1994 | 30 | 36 | 26 | 36 | 8 | 42 | 17 | 13 | 58 | 42 | 9 | 58 |
| 1995 | 22 | 53 | 30 | 4 | 34 | 12 | 1 | 6 | 5 | 2 | 18 | 35 |
| 1996 | 20 | 26 | 7 | 15 | 60 | 1 | 30 | 12 | 48 | 13 | 14 | 70 |
| 1997 | 1 | 49 | 5 | 6 | 1 | 1 | 27 | 6 | 3 | 1 | 1 | 43 |
| 1998 | 1 | 48 | 1 | 1 | 44 | 1 | 13 | 9 | 10 | 34 | 2 | 3 |
| 1999 | 23 | 13 | 1 | 21 | 5 | 1 | 13 | 2 | 3 | 11 | 11 | 1 |
| 2000 | 1 | 1 | 2 | 1 | 10 | 33 | 1 | 19 | 7 | 4 | 20 | 6 |
| 2001 | 0 | 1 | 1 | 1 | 0 | 2 | 0 | 14 | 0 | 1 | 1 | 7 |
| 2002 | 0 | 1 | 12 | 2 | 1 | 1 | 0 | 1 | 1 | 0 | 1 | 0 |
| 2003 | 2 | 1 | 1 | 1 | 1 | 5 | 2 | 1 | 1 | 1 | 1 | 1 |
| 2004 | 1 | 1 | 2 | 1 | 1 | 1 | 1 | 9 | 1 | 1 | 0 | 2 |
| 2005 | 0 | 2 | 0 | 0 | 0 | 0 | 2 | 0 | 1 | 0 | 1 | 1 |
| 2006 | 0 | 0 | 0 | 0 | 0 | 2 | 1 | 1 | 4 | 1 | 1 | 1 |
| 2007 | 9 | 0 | 1 | 1 | 2 | 2 | 2 | 0 | 2 | 0 | 0 | 2 |
| 2008 | 20 | 2 | 0 | 4 | 12 | 4 | 29 | 1 | 0 | 0 | 0 | 0 |
| 2009 | 0 | 2 | 5 | 1 | 2 | 8 | 0 | 1 | 2 | 2 | 1 | 1 |
| 2010 | 1 | 0 | 0 | 0 | 2 | 1 | 0 | 0 | 1 | 0 | 1 | 0 |
| 2011 | 0 | 2 | 1 | 0 | 2 | 2 | 0 | 0 | 1 | 1 | 11 | 0 |
| 2012 | 1 | 3 | 26 | 10 | 0 | 1 | 9 | 11 | 0 | 18 | 20 | 19 |
| 2013 | 8 | 19 | 0 | 10 | 4 | 25 | 21 | 11 | 0 | 1 | 0 | 0 |
| 2014 | 11 | 6 | 0 | 22 | 20 | 8 | 48 | 5 | 11 | 20 | 0 | 10 |
| 2015 | 0 | 0 | 0 | 20 | 13 | 9 | 2 | 5 | 0 | 0 | 11 | 0 |
| 2016 | 11 | 0 | 16 | 5 | 1 | 0 | 0 | 0 | 2 | 19 | 0 | 19 |
| 2017 | 14 | 17 | 17 | 1 | 10 | 1 | 0 | 0 | 15 | 49 | 80 | 52 |
| 2018 | 142 | 28 | 102 | 176 | 104 | 117 | 265 | 206 | 292 | 137 | 193 | 155 |
| 2019 | 213 | 333 | 186 | 191 | 275 | 244 | 202 | 131 | 245 | 191 | 187 | 173 |
| 2020 | 237 | 237 | 309 | 257 | 115 | 267 | 63 | 224 | 121 | 151 | 125 | 48 |
| 2021 | 171 | 25 | 303 | 211 | 199 | 193 | 88 | 85 | 75 | 143 | 185 | 179 |
| 2022 | 128 | 235 | 234 | 155 | 180 | 142 | 262 | 296 | 120 | 145 | 185 | 362 |
| 2023 | 179 | 227 | 244 | 221 | 182 | 378 | 231 | 216 | 148 | 184 | 328 | 323 |
| 2024 | 233 | |||||||||||
| - = No Data Reported; -- = Not Applicable; NA = Not Available; W = Withheld to avoid disclosure of individual company data. |
| Release Date: 3/29/2024 |
| Next Release Date: 4/30/2024 |