|
Download Data (XLS File) |
|
||||||||
|
||||||||
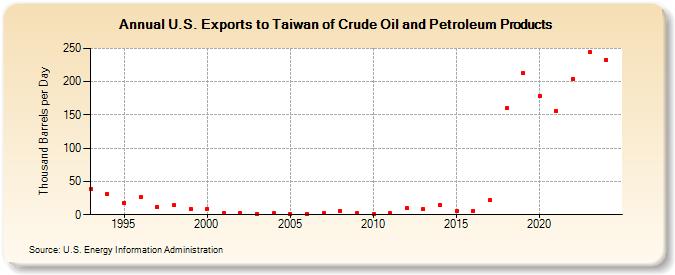
| U.S. Exports to Taiwan of Crude Oil and Petroleum Products (Thousand Barrels per Day) | ||||||||
| Decade | Year-0 | Year-1 | Year-2 | Year-3 | Year-4 | Year-5 | Year-6 | Year-7 | Year-8 | Year-9 |
|---|---|---|---|---|---|---|---|---|---|---|
| 1990's | 39 | 31 | 18 | 26 | 12 | 14 | 9 | |||
| 2000's | 9 | 2 | 2 | 1 | 2 | 1 | 1 | 2 | 6 | 2 |
| 2010's | 1 | 2 | 10 | 8 | 14 | 5 | 6 | 22 | 160 | 213 |
| 2020's | 179 | 156 | 204 | 238 |
| - = No Data Reported; -- = Not Applicable; NA = Not Available; W = Withheld to avoid disclosure of individual company data. |
| Release Date: 6/28/2024 |
| Next Release Date: 8/30/2024 |