|
Download Data (XLS File) |
|
||||||||
|
||||||||
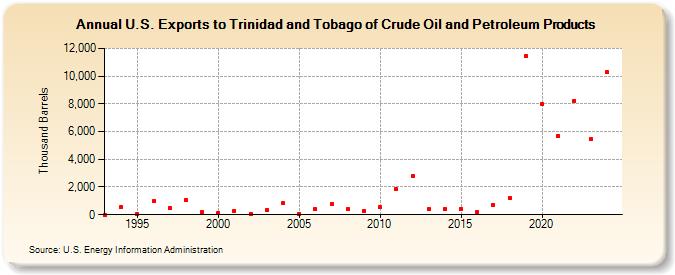
| U.S. Exports to Trinidad and Tobago of Crude Oil and Petroleum Products (Thousand Barrels) | ||||||||
| Decade | Year-0 | Year-1 | Year-2 | Year-3 | Year-4 | Year-5 | Year-6 | Year-7 | Year-8 | Year-9 |
|---|---|---|---|---|---|---|---|---|---|---|
| 1990's | 8 | 536 | 19 | 989 | 499 | 1,070 | 186 | |||
| 2000's | 118 | 296 | 69 | 312 | 832 | 54 | 387 | 737 | 422 | 281 |
| 2010's | 547 | 1,839 | 2,787 | 398 | 412 | 444 | 189 | 720 | 1,213 | 11,457 |
| 2020's | 7,994 | 5,679 | 8,240 | 5,209 |
| - = No Data Reported; -- = Not Applicable; NA = Not Available; W = Withheld to avoid disclosure of individual company data. |
| Release Date: 6/28/2024 |
| Next Release Date: 8/30/2024 |