|
Download Data (XLS File) |
|
||||||||
|
||||||||
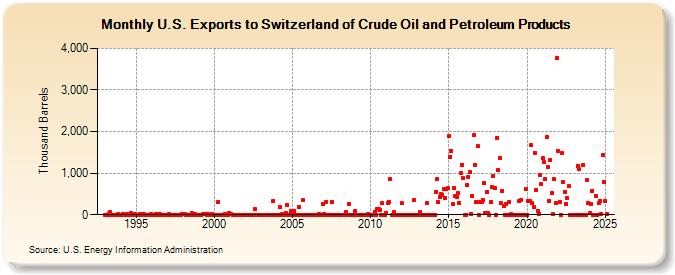
| U.S. Exports to Switzerland of Crude Oil and Petroleum Products (Thousand Barrels) | ||||||||
| Year | Jan | Feb | Mar | Apr | May | Jun | Jul | Aug | Sep | Oct | Nov | Dec |
|---|---|---|---|---|---|---|---|---|---|---|---|---|
| 1993 | 1 | 0 | 0 | 8 | 58 | 1 | 0 | 0 | 1 | 0 | 6 | 0 |
| 1994 | 1 | 3 | 7 | 1 | 1 | 7 | 1 | 0 | 31 | 0 | 0 | 9 |
| 1995 | 0 | 3 | 0 | 10 | 1 | 11 | 7 | 0 | 0 | 0 | 2 | 7 |
| 1996 | 0 | 0 | 1 | 9 | 8 | 0 | 8 | 0 | 2 | 0 | 0 | 0 |
| 1997 | 0 | 9 | 0 | 0 | 1 | 0 | 2 | 1 | 1 | 0 | 1 | 6 |
| 1998 | 10 | 9 | 0 | 0 | 0 | 0 | 0 | 32 | 0 | 9 | 2 | 0 |
| 1999 | 2 | 0 | 0 | 9 | 20 | 23 | 0 | 6 | 1 | 3 | 18 | 1 |
| 2000 | 1 | 0 | 2 | 307 | 2 | 0 | 0 | 4 | 12 | 0 | 0 | 51 |
| 2001 | 27 | 18 | 1 | 1 | 1 | 0 | 1 | 2 | 0 | 3 | 3 | 0 |
| 2002 | 0 | 0 | 0 | 1 | 0 | 0 | 2 | 141 | 1 | 2 | 0 | 1 |
| 2003 | 2 | 0 | 0 | 0 | 1 | 1 | 1 | 0 | 1 | 333 | 0 | 1 |
| 2004 | 1 | 1 | 178 | 1 | 10 | 1 | 2 | 41 | 238 | 0 | 0 | 83 |
| 2005 | 0 | 93 | 0 | 1 | 0 | 197 | 1 | 0 | 353 | 1 | 2 | |
| 2006 | 0 | 0 | 1 | 1 | 0 | 3 | 1 | 0 | 28 | 1 | 0 | 267 |
| 2007 | 15 | 0 | 316 | 0 | 0 | 3 | 297 | 0 | 0 | 0 | 1 | 1 |
| 2008 | 0 | 0 | 0 | 0 | 0 | 69 | 1 | 248 | 0 | 0 | 0 | 0 |
| 2009 | 83 | 1 | 0 | 0 | 0 | 0 | 0 | 1 | 0 | 0 | 10 | 0 |
| 2010 | 1 | 1 | 1 | 67 | 1 | 133 | 137 | 122 | 0 | 276 | 0 | 0 |
| 2011 | 53 | 273 | 317 | 854 | 0 | 1 | 56 | 0 | 0 | 1 | 0 | 1 |
| 2012 | 275 | 1 | 1 | 0 | 0 | 0 | 0 | 0 | 0 | 355 | 0 | 0 |
| 2013 | 0 | 54 | 0 | 1 | 0 | 0 | 280 | 0 | 0 | 0 | 0 | |
| 2014 | 0 | 1 | 556 | 859 | 300 | 438 | 505 | 483 | 612 | 390 | 608 | 632 |
| 2015 | 1,904 | 1,398 | 1,542 | 269 | 652 | 449 | 425 | 521 | 290 | 1,002 | 1,204 | 887 |
| 2016 | 0 | 0 | 720 | 914 | 1,030 | 20 | 440 | 1,906 | 1,207 | 309 | 1,643 | 0 |
| 2017 | 315 | 313 | 345 | 757 | 41 | 555 | 30 | 4 | 302 | 665 | 926 | 639 |
| 2018 | 5 | 1,855 | 1,071 | 1,365 | 276 | 580 | 215 | 4 | 255 | 4 | 303 | 4 |
| 2019 | 7 | 3 | 0 | 0 | 1 | 2 | 321 | 355 | 1 | 1 | 2 | 628 |
| 2020 | 1 | 318 | 340 | 1,669 | 272 | 179 | 1,496 | 598 | 97 | 24 | 956 | 738 |
| 2021 | 1,352 | 1,277 | 855 | 1,874 | 1,157 | 330 | 1,326 | 526 | 9 | 850 | 291 | 3,759 |
| 2022 | 1,538 | 310 | 2 | 1,486 | 775 | 550 | 269 | 391 | 680 | 2 | 4 | 3 |
| 2023 | 2 | 3 | 1 | 1,022 | 1,408 | 2 | 3 | 1,197 | 2 | 2 | 823 | 917 |
| 2024 | 32 | |||||||||||
| - = No Data Reported; -- = Not Applicable; NA = Not Available; W = Withheld to avoid disclosure of individual company data. |
| Release Date: 3/29/2024 |
| Next Release Date: 4/30/2024 |