|
Download Data (XLS File) |
|
||||||||
|
||||||||
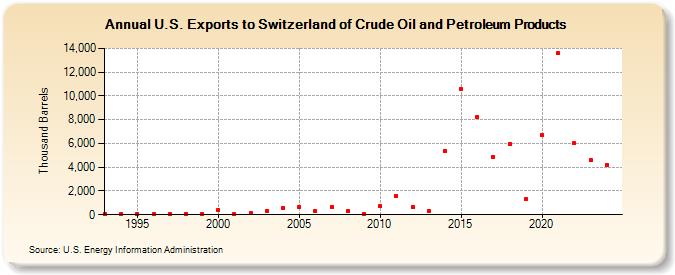
| U.S. Exports to Switzerland of Crude Oil and Petroleum Products (Thousand Barrels) | ||||||||
| Decade | Year-0 | Year-1 | Year-2 | Year-3 | Year-4 | Year-5 | Year-6 | Year-7 | Year-8 | Year-9 |
|---|---|---|---|---|---|---|---|---|---|---|
| 1990's | 76 | 63 | 42 | 30 | 21 | 65 | 85 | |||
| 2000's | 380 | 55 | 149 | 340 | 556 | 648 | 303 | 633 | 320 | 95 |
| 2010's | 738 | 1,556 | 634 | 335 | 5,385 | 10,543 | 8,190 | 4,892 | 5,938 | 1,322 |
| 2020's | 6,690 | 13,604 | 6,010 | 4,598 |
| - = No Data Reported; -- = Not Applicable; NA = Not Available; W = Withheld to avoid disclosure of individual company data. |
| Release Date: 8/30/2024 |
| Next Release Date: 8/29/2025 |