|
Download Data (XLS File) |
|
||||||||
|
||||||||
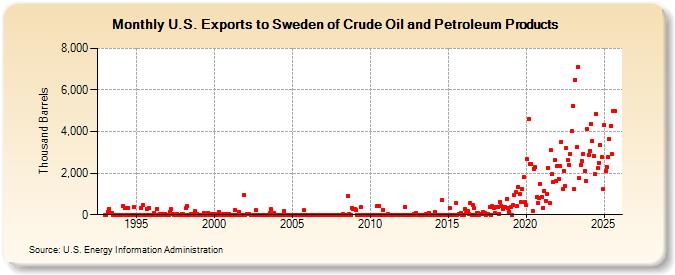
| U.S. Exports to Sweden of Crude Oil and Petroleum Products (Thousand Barrels) | ||||||||
| Year | Jan | Feb | Mar | Apr | May | Jun | Jul | Aug | Sep | Oct | Nov | Dec |
|---|---|---|---|---|---|---|---|---|---|---|---|---|
| 1993 | 2 | 1 | 139 | 293 | 83 | 79 | 2 | 1 | 2 | 3 | 5 | 2 |
| 1994 | 2 | 1 | 421 | 308 | 4 | 2 | 342 | 1 | 1 | 1 | 364 | 2 |
| 1995 | 1 | 1 | 3 | 2 | 322 | 476 | 2 | 2 | 275 | 2 | 324 | 2 |
| 1996 | 2 | 2 | 90 | 2 | 287 | 2 | 33 | 31 | 2 | 33 | 32 | 2 |
| 1997 | 1 | 1 | 141 | 252 | 53 | 4 | 1 | 32 | 4 | 0 | 5 | 30 |
| 1998 | 26 | 2 | 309 | 406 | 2 | 1 | 31 | 1 | 35 | 156 | 4 | 32 |
| 1999 | 2 | 9 | 1 | 5 | 89 | 2 | 1 | 60 | 36 | 2 | 28 | 3 |
| 2000 | 38 | 2 | 8 | 38 | 140 | 2 | 1 | 36 | 1 | 29 | 1 | 58 |
| 2001 | 1 | 0 | 9 | 0 | 220 | 1 | 3 | 138 | 5 | 0 | 1 | 965 |
| 2002 | 0 | 57 | 37 | 29 | 0 | 1 | 0 | 2 | 231 | 4 | 4 | 1 |
| 2003 | 0 | 0 | 4 | 2 | 4 | 3 | 1 | 66 | 258 | 1 | 82 | 2 |
| 2004 | 0 | 2 | 1 | 1 | 2 | 10 | 202 | 3 | 1 | 2 | 2 | 1 |
| 2005 | 2 | 1 | 1 | 4 | 3 | 1 | 3 | 1 | 2 | 204 | 0 | 1 |
| 2006 | 0 | 1 | 3 | 1 | 1 | 1 | 1 | 1 | 1 | 1 | 1 | 0 |
| 2007 | 1 | 6 | 1 | 1 | 3 | 1 | 2 | 1 | 2 | 2 | 2 | 1 |
| 2008 | 2 | 2 | 2 | 18 | 1 | 4 | 4 | 893 | 16 | 0 | 316 | 281 |
| 2009 | 268 | 212 | 1 | 1 | 2 | 349 | 2 | 2 | 2 | 3 | 1 | 1 |
| 2010 | 7 | 2 | 2 | 2 | 2 | 413 | 2 | 412 | 1 | 2 | 249 | 2 |
| 2011 | 3 | 3 | 29 | 3 | 0 | 3 | 1 | 2 | 2 | 1 | 2 | 1 |
| 2012 | 4 | 1 | 1 | 365 | 1 | 10 | 1 | 1 | 0 | 1 | 19 | 83 |
| 2013 | 1 | 1 | 0 | 1 | 2 | 1 | 1 | 33 | 1 | 89 | 1 | 2 |
| 2014 | 1 | 1 | 131 | 1 | 2 | 2 | 1 | 713 | 2 | 4 | 2 | 1 |
| 2015 | 4 | 329 | 0 | 4 | 1 | 2 | 574 | 1 | 28 | 29 | 102 | 2 |
| 2016 | 1 | 280 | 72 | 164 | 34 | 574 | 1 | 476 | 299 | 1 | 106 | 88 |
| 2017 | 7 | 35 | 49 | 153 | 97 | 3 | 50 | 50 | 375 | 1 | 402 | 321 |
| 2018 | 63 | 375 | 383 | 25 | 620 | 435 | 266 | 358 | 375 | 748 | 331 | 147 |
| 2019 | 372 | 2 | 463 | 961 | 1,069 | 417 | 1,342 | 992 | 595 | 1,237 | 1,801 | 623 |
| 2020 | 446 | 2,656 | 4,583 | 2,426 | 2,428 | 187 | 2,201 | 2,288 | 830 | 586 | 810 | 1,479 |
| 2021 | 855 | 341 | 1,137 | 676 | 998 | 2,267 | 553 | 3,093 | 1,948 | 1,558 | 2,617 | 1,616 |
| 2022 | 2,364 | 1,730 | 2,322 | 3,510 | 1,216 | 2,103 | 1,361 | 3,218 | 2,632 | 2,411 | 2,944 | 4,007 |
| 2023 | 5,421 | 2,038 | 4,447 | 3,912 | 7,009 | 1,743 | 2,384 | 2,575 | 2,934 | 2,111 | 1,614 | 3,943 |
| 2024 | 2,883 | |||||||||||
| - = No Data Reported; -- = Not Applicable; NA = Not Available; W = Withheld to avoid disclosure of individual company data. |
| Release Date: 3/29/2024 |
| Next Release Date: 4/30/2024 |