|
Download Data (XLS File) |
|
||||||||
|
||||||||
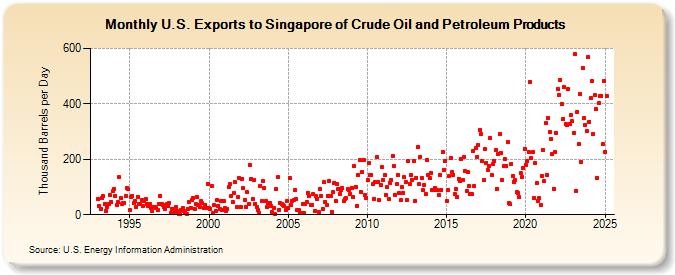
| U.S. Exports to Singapore of Crude Oil and Petroleum Products (Thousand Barrels per Day) | ||||||||
| Year | Jan | Feb | Mar | Apr | May | Jun | Jul | Aug | Sep | Oct | Nov | Dec |
|---|---|---|---|---|---|---|---|---|---|---|---|---|
| 1993 | 56 | 32 | 21 | 61 | 66 | 39 | 15 | 29 | 40 | 70 | 46 | 84 |
| 1994 | 94 | 69 | 36 | 46 | 136 | 61 | 39 | 43 | 42 | 67 | 97 | 91 |
| 1995 | 16 | 65 | 69 | 41 | 48 | 29 | 65 | 40 | 40 | 53 | 33 | 50 |
| 1996 | 56 | 38 | 30 | 38 | 25 | 12 | 29 | 29 | 24 | 17 | 40 | 68 |
| 1997 | 38 | 36 | 28 | 21 | 37 | 30 | 43 | 7 | 19 | 21 | 11 | 28 |
| 1998 | 13 | 2 | 1 | 18 | 23 | 13 | 8 | 4 | 22 | 47 | 25 | 53 |
| 1999 | 61 | 20 | 39 | 64 | 34 | 28 | 49 | 41 | 26 | 36 | 23 | 112 |
| 2000 | 24 | 22 | 104 | 6 | 34 | 13 | 53 | 32 | 21 | 51 | 17 | 48 |
| 2001 | 26 | 15 | 20 | 99 | 110 | 68 | 46 | 79 | 117 | 27 | 63 | 132 |
| 2002 | 28 | 129 | 95 | 54 | 28 | 81 | 38 | 179 | 130 | 57 | 127 | 39 |
| 2003 | 27 | 17 | 7 | 105 | 50 | 121 | 96 | 48 | 28 | 41 | 41 | 31 |
| 2004 | 8 | 26 | 2 | 92 | 135 | 18 | 42 | 39 | 34 | 31 | 16 | 49 |
| 2005 | 26 | 131 | 36 | 50 | 53 | 90 | 55 | 18 | 16 | 5 | 7 | 40 |
| 2006 | 6 | 39 | 46 | 80 | 66 | 36 | 36 | 75 | 14 | 69 | 57 | 10 |
| 2007 | 91 | 67 | 21 | 117 | 47 | 36 | 69 | 123 | 68 | 10 | 81 | 116 |
| 2008 | 50 | 109 | 94 | 75 | 88 | 95 | 48 | 55 | 60 | 92 | 88 | 76 |
| 2009 | 98 | 63 | 174 | 101 | 32 | 144 | 197 | 83 | 154 | 199 | 71 | 62 |
| 2010 | 124 | 185 | 145 | 145 | 111 | 58 | 118 | 208 | 119 | 52 | 106 | 171 |
| 2011 | 127 | 143 | 72 | 99 | 55 | 116 | 126 | 212 | 176 | 72 | 110 | 144 |
| 2012 | 77 | 52 | 99 | 79 | 135 | 118 | 54 | 193 | 109 | 143 | 127 | 195 |
| 2013 | 50 | 134 | 245 | 110 | 210 | 134 | 90 | 107 | 76 | 198 | 145 | 131 |
| 2014 | 151 | 90 | 90 | 95 | 89 | 88 | 70 | 143 | 90 | 228 | 162 | 192 |
| 2015 | 48 | 89 | 138 | 204 | 154 | 145 | 74 | 92 | 64 | 130 | 122 | 201 |
| 2016 | 124 | 209 | 157 | 86 | 154 | 104 | 75 | 75 | 229 | 104 | 239 | 210 |
| 2017 | 252 | 306 | 291 | 192 | 125 | 237 | 188 | 162 | 174 | 278 | 143 | 182 |
| 2018 | 193 | 232 | 94 | 218 | 291 | 223 | 125 | 176 | 200 | 176 | 263 | 43 |
| 2019 | 37 | 184 | 140 | 119 | 124 | 82 | 79 | 63 | 149 | 137 | 168 | 237 |
| 2020 | 178 | 192 | 225 | 480 | 204 | 225 | 60 | 185 | 114 | 51 | 60 | 34 |
| 2021 | 141 | 234 | 120 | 330 | 144 | 349 | 298 | 273 | 220 | 94 | 228 | 296 |
| 2022 | 452 | 431 | 486 | 401 | 346 | 459 | 326 | 322 | 452 | 327 | 360 | 337 |
| 2023 | 330 | 529 | 88 | 393 | 267 | 364 | 222 | 424 | 340 | 319 | 332 | 549 |
| 2024 | 336 | |||||||||||
| - = No Data Reported; -- = Not Applicable; NA = Not Available; W = Withheld to avoid disclosure of individual company data. |
| Release Date: 3/29/2024 |
| Next Release Date: 4/30/2024 |