|
Download Data (XLS File) |
|
||||||||
|
||||||||
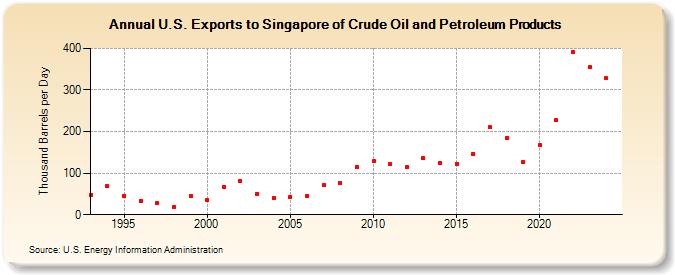
| U.S. Exports to Singapore of Crude Oil and Petroleum Products (Thousand Barrels per Day) | ||||||||
| Decade | Year-0 | Year-1 | Year-2 | Year-3 | Year-4 | Year-5 | Year-6 | Year-7 | Year-8 | Year-9 |
|---|---|---|---|---|---|---|---|---|---|---|
| 1990's | 47 | 68 | 46 | 34 | 27 | 19 | 45 | |||
| 2000's | 36 | 67 | 81 | 51 | 41 | 43 | 45 | 71 | 77 | 115 |
| 2010's | 128 | 121 | 115 | 136 | 124 | 122 | 147 | 210 | 185 | 126 |
| 2020's | 167 | 227 | 391 | 345 |
| - = No Data Reported; -- = Not Applicable; NA = Not Available; W = Withheld to avoid disclosure of individual company data. |
| Release Date: 3/29/2024 |
| Next Release Date: 8/30/2024 |