|
Download Data (XLS File) |
|
||||||||
|
||||||||
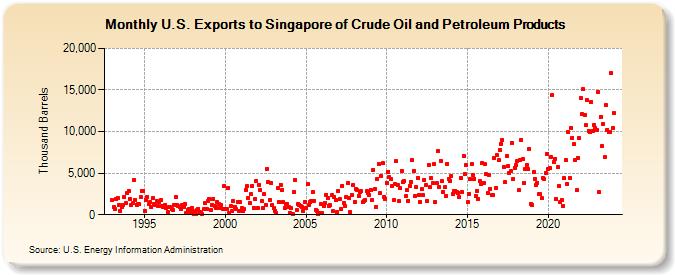
| U.S. Exports to Singapore of Crude Oil and Petroleum Products (Thousand Barrels) | ||||||||
| Year | Jan | Feb | Mar | Apr | May | Jun | Jul | Aug | Sep | Oct | Nov | Dec |
|---|---|---|---|---|---|---|---|---|---|---|---|---|
| 1993 | 1,745 | 903 | 642 | 1,831 | 2,034 | 1,161 | 461 | 893 | 1,211 | 2,156 | 1,378 | 2,603 |
| 1994 | 2,899 | 1,941 | 1,120 | 1,374 | 4,216 | 1,818 | 1,213 | 1,323 | 1,270 | 2,071 | 2,909 | 2,809 |
| 1995 | 491 | 1,828 | 2,136 | 1,237 | 1,489 | 872 | 2,001 | 1,237 | 1,190 | 1,657 | 998 | 1,535 |
| 1996 | 1,731 | 1,094 | 944 | 1,154 | 769 | 357 | 894 | 905 | 707 | 541 | 1,195 | 2,093 |
| 1997 | 1,190 | 1,016 | 873 | 641 | 1,155 | 888 | 1,319 | 214 | 578 | 658 | 342 | 861 |
| 1998 | 390 | 63 | 32 | 540 | 701 | 377 | 256 | 109 | 645 | 1,454 | 743 | 1,643 |
| 1999 | 1,876 | 556 | 1,220 | 1,927 | 1,059 | 852 | 1,523 | 1,272 | 777 | 1,120 | 683 | 3,460 |
| 2000 | 730 | 640 | 3,229 | 192 | 1,057 | 389 | 1,643 | 979 | 636 | 1,581 | 498 | 1,489 |
| 2001 | 801 | 426 | 630 | 2,959 | 3,418 | 2,039 | 1,416 | 2,451 | 3,505 | 846 | 1,902 | 4,087 |
| 2002 | 856 | 3,618 | 2,945 | 1,633 | 860 | 2,433 | 1,176 | 5,551 | 3,891 | 1,760 | 3,814 | 1,200 |
| 2003 | 851 | 488 | 210 | 3,156 | 1,561 | 3,631 | 2,961 | 1,478 | 828 | 1,284 | 1,241 | 972 |
| 2004 | 240 | 748 | 68 | 2,770 | 4,181 | 539 | 1,313 | 1,217 | 1,010 | 976 | 493 | 1,528 |
| 2005 | 804 | 3,675 | 1,119 | 1,486 | 1,630 | 2,698 | 1,704 | 569 | 486 | 140 | 205 | 1,246 |
| 2006 | 184 | 1,090 | 1,435 | 2,395 | 2,051 | 1,092 | 1,115 | 2,313 | 414 | 2,148 | 1,722 | 322 |
| 2007 | 2,833 | 1,881 | 656 | 3,503 | 1,466 | 1,072 | 2,138 | 3,826 | 2,039 | 320 | 2,416 | 3,610 |
| 2008 | 1,564 | 3,151 | 2,917 | 2,246 | 2,727 | 2,850 | 1,493 | 1,706 | 1,798 | 2,851 | 2,651 | 2,345 |
| 2009 | 3,024 | 1,777 | 5,402 | 3,035 | 986 | 4,328 | 6,121 | 2,567 | 4,629 | 6,168 | 2,145 | 1,933 |
| 2010 | 3,844 | 5,175 | 4,493 | 4,351 | 3,448 | 1,747 | 3,667 | 6,445 | 3,569 | 1,615 | 3,167 | 5,298 |
| 2011 | 3,944 | 4,010 | 2,230 | 2,975 | 1,691 | 3,471 | 3,920 | 6,573 | 5,279 | 2,246 | 3,291 | 4,462 |
| 2012 | 2,375 | 1,511 | 3,068 | 2,365 | 4,185 | 3,547 | 1,659 | 5,992 | 3,281 | 4,426 | 3,800 | 6,049 |
| 2013 | 1,549 | 3,757 | 7,608 | 3,304 | 6,512 | 4,034 | 2,786 | 3,302 | 2,289 | 6,146 | 4,342 | 4,060 |
| 2014 | 4,673 | 2,518 | 2,797 | 2,862 | 2,757 | 2,650 | 2,156 | 4,446 | 2,690 | 7,064 | 4,852 | 5,949 |
| 2015 | 1,494 | 2,496 | 4,283 | 6,111 | 4,777 | 4,354 | 2,294 | 2,855 | 1,905 | 4,020 | 3,661 | 6,227 |
| 2016 | 3,853 | 6,059 | 4,879 | 2,589 | 4,763 | 3,135 | 2,334 | 2,320 | 6,858 | 3,215 | 7,174 | 6,520 |
| 2017 | 7,818 | 8,559 | 9,011 | 5,762 | 3,882 | 7,103 | 5,833 | 5,028 | 5,209 | 8,627 | 4,295 | 5,637 |
| 2018 | 5,988 | 6,504 | 2,924 | 6,535 | 9,015 | 6,687 | 3,866 | 5,463 | 6,011 | 5,446 | 7,884 | 1,318 |
| 2019 | 1,157 | 5,150 | 4,346 | 3,583 | 3,842 | 2,448 | 2,457 | 1,956 | 4,455 | 4,237 | 5,038 | 7,341 |
| 2020 | 5,513 | 5,582 | 6,966 | 14,411 | 6,326 | 6,739 | 1,870 | 5,727 | 3,429 | 1,579 | 1,803 | 1,049 |
| 2021 | 4,382 | 6,551 | 3,715 | 9,891 | 4,471 | 10,462 | 9,243 | 8,475 | 6,599 | 2,929 | 6,852 | 9,168 |
| 2022 | 14,021 | 12,059 | 15,075 | 12,030 | 10,741 | 13,771 | 10,101 | 9,993 | 13,570 | 10,125 | 10,808 | 10,452 |
| 2023 | 10,230 | 14,814 | 2,717 | 11,789 | 8,275 | 10,924 | 6,889 | 13,134 | 10,201 | 9,887 | 9,957 | 17,016 |
| 2024 | 10,418 | |||||||||||
| - = No Data Reported; -- = Not Applicable; NA = Not Available; W = Withheld to avoid disclosure of individual company data. |
| Release Date: 3/29/2024 |
| Next Release Date: 4/30/2024 |