|
Download Data (XLS File) |
|
||||||||
|
||||||||
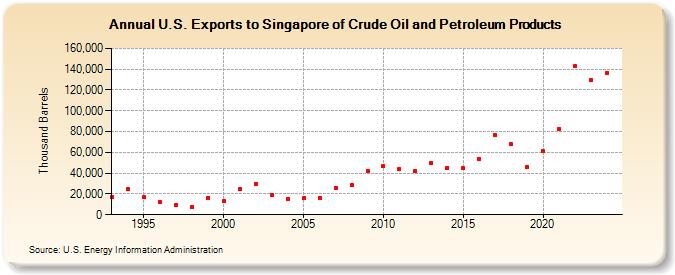
| U.S. Exports to Singapore of Crude Oil and Petroleum Products (Thousand Barrels) | ||||||||
| Decade | Year-0 | Year-1 | Year-2 | Year-3 | Year-4 | Year-5 | Year-6 | Year-7 | Year-8 | Year-9 |
|---|---|---|---|---|---|---|---|---|---|---|
| 1990's | 17,019 | 24,962 | 16,671 | 12,384 | 9,735 | 6,954 | 16,323 | |||
| 2000's | 13,064 | 24,481 | 29,738 | 18,660 | 15,083 | 15,760 | 16,281 | 25,760 | 28,299 | 42,116 |
| 2010's | 46,819 | 44,092 | 42,258 | 49,690 | 45,413 | 44,478 | 53,700 | 76,764 | 67,643 | 46,010 |
| 2020's | 60,995 | 82,738 | 142,745 | 129,597 | 136,388 |
| - = No Data Reported; -- = Not Applicable; NA = Not Available; W = Withheld to avoid disclosure of individual company data. |
| Release Date: 6/30/2025 |
| Next Release Date: 8/29/2025 |