|
Download Data (XLS File) |
|
||||||||
|
||||||||
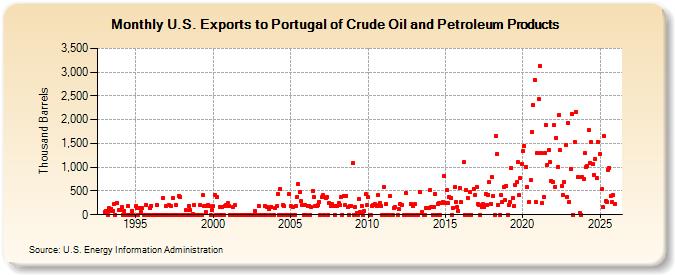
| U.S. Exports to Portugal of Crude Oil and Petroleum Products (Thousand Barrels) | ||||||||
| Year | Jan | Feb | Mar | Apr | May | Jun | Jul | Aug | Sep | Oct | Nov | Dec |
|---|---|---|---|---|---|---|---|---|---|---|---|---|
| 1993 | 64 | 82 | 0 | 140 | 79 | 130 | 86 | 230 | 0 | 236 | 99 | |
| 1994 | 99 | 156 | 0 | 80 | 0 | 0 | 186 | 0 | 0 | 87 | 0 | |
| 1995 | 183 | 144 | 0 | 139 | 53 | 132 | 0 | 0 | 205 | 0 | 0 | 132 |
| 1996 | 193 | 0 | 0 | 0 | 206 | 0 | 0 | 0 | 0 | 356 | 0 | 181 |
| 1997 | 1 | 0 | 200 | 191 | 0 | 346 | 0 | 201 | 0 | 391 | 374 | 0 |
| 1998 | 0 | 0 | 0 | 92 | 0 | 181 | 90 | 0 | 24 | 209 | 0 | 0 |
| 1999 | 0 | 0 | 199 | 0 | 414 | 181 | 54 | 179 | 201 | 182 | 0 | 101 |
| 2000 | 174 | 410 | 0 | 367 | 0 | 170 | 0 | 158 | 0 | 184 | 212 | 236 |
| 2001 | 173 | 0 | 0 | 167 | 0 | 195 | 0 | 1 | 0 | 0 | 0 | 0 |
| 2002 | 0 | 0 | 0 | 0 | 0 | 0 | 0 | 0 | 81 | 0 | 0 | 179 |
| 2003 | 0 | 0 | 0 | 0 | 185 | 0 | 158 | 110 | 0 | 169 | 0 | 0 |
| 2004 | 134 | 181 | 439 | 0 | 543 | 0 | 199 | 175 | 0 | 0 | 0 | 432 |
| 2005 | 173 | 0 | 171 | 0 | 185 | 383 | 638 | 469 | 282 | 196 | 0 | 200 |
| 2006 | 0 | 186 | 193 | 0 | 152 | 503 | 374 | 181 | 186 | 200 | 276 | 0 |
| 2007 | 365 | 408 | 0 | 359 | 364 | 0 | 249 | 186 | 217 | 186 | 0 | 184 |
| 2008 | 193 | 238 | 212 | 376 | 0 | 394 | 194 | 398 | 165 | 0 | 193 | 193 |
| 2009 | 1,080 | 0 | 170 | 27 | 0 | 331 | 59 | 193 | 0 | 69 | 429 | 194 |
| 2010 | 368 | 0 | 0 | 193 | 199 | 217 | 199 | 192 | 411 | 236 | 193 | 0 |
| 2011 | 584 | 0 | 224 | 0 | 0 | 387 | 0 | 0 | 143 | 153 | 0 | |
| 2012 | 110 | 228 | 214 | 0 | 447 | 0 | 0 | 0 | 226 | 0 | 186 | |
| 2013 | 220 | 0 | 0 | 0 | 473 | 54 | 0 | 0 | 135 | 147 | 135 | |
| 2014 | 512 | 165 | 0 | 155 | 445 | 0 | 233 | 245 | 0 | 236 | 267 | 817 |
| 2015 | 237 | 515 | 242 | 380 | 354 | 0 | 145 | 579 | 275 | 153 | 81 | 560 |
| 2016 | 267 | 1,099 | 0 | 523 | 357 | 0 | 477 | 0 | 550 | 417 | ||
| 2017 | 584 | 224 | 209 | 0 | 170 | 216 | 158 | 439 | 212 | 419 | 682 | 233 |
| 2018 | 786 | 404 | 0 | 1,651 | 1,282 | 213 | 0 | 415 | 267 | 576 | 306 | 606 |
| 2019 | 1 | 211 | 275 | 981 | 354 | 185 | 624 | 681 | 1,100 | 413 | 772 | 1,064 |
| 2020 | 1,334 | 1,456 | 1,001 | 587 | 275 | 725 | 1,740 | 2,305 | 2,841 | 270 | 1,304 | |
| 2021 | 2,434 | 3,129 | 1,295 | 246 | 379 | 1,301 | 1,886 | 1,056 | 1,364 | 1,113 | 714 | 686 |
| 2022 | 1,881 | 588 | 1,617 | 1,003 | 2,091 | 1,352 | 607 | 420 | 685 | 1,460 | 370 | 1,928 |
| 2023 | 963 | 265 | 2,043 | 0 | 1,534 | 1,590 | 795 | 33 | 0 | 786 | 977 | |
| 2024 | 1,156 | |||||||||||
| - = No Data Reported; -- = Not Applicable; NA = Not Available; W = Withheld to avoid disclosure of individual company data. |
| Release Date: 3/29/2024 |
| Next Release Date: 4/30/2024 |