|
Download Data (XLS File) |
|
||||||||
|
||||||||
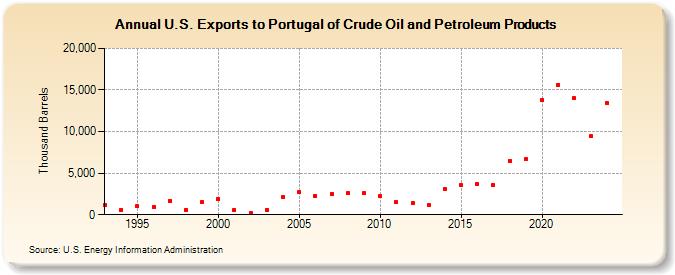
| U.S. Exports to Portugal of Crude Oil and Petroleum Products (Thousand Barrels) | ||||||||
| Decade | Year-0 | Year-1 | Year-2 | Year-3 | Year-4 | Year-5 | Year-6 | Year-7 | Year-8 | Year-9 |
|---|---|---|---|---|---|---|---|---|---|---|
| 1990's | 1,146 | 608 | 988 | 937 | 1,704 | 597 | 1,511 | |||
| 2000's | 1,912 | 537 | 261 | 623 | 2,104 | 2,696 | 2,252 | 2,519 | 2,557 | 2,553 |
| 2010's | 2,209 | 1,492 | 1,412 | 1,165 | 3,076 | 3,520 | 3,691 | 3,545 | 6,506 | 6,660 |
| 2020's | 13,840 | 15,603 | 14,000 | 8,985 |
| - = No Data Reported; -- = Not Applicable; NA = Not Available; W = Withheld to avoid disclosure of individual company data. |
| Release Date: 3/29/2024 |
| Next Release Date: 8/30/2024 |