|
Download Data (XLS File) |
|
||||||||
|
||||||||
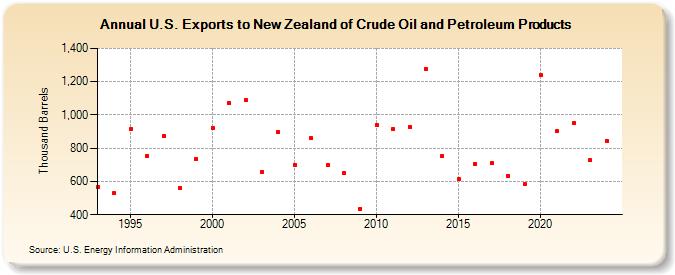
| U.S. Exports to New Zealand of Crude Oil and Petroleum Products (Thousand Barrels) | ||||||||
| Decade | Year-0 | Year-1 | Year-2 | Year-3 | Year-4 | Year-5 | Year-6 | Year-7 | Year-8 | Year-9 |
|---|---|---|---|---|---|---|---|---|---|---|
| 1990's | 566 | 528 | 913 | 752 | 874 | 560 | 735 | |||
| 2000's | 923 | 1,072 | 1,087 | 659 | 897 | 701 | 861 | 696 | 648 | 435 |
| 2010's | 940 | 914 | 928 | 1,277 | 751 | 613 | 705 | 710 | 635 | 584 |
| 2020's | 1,238 | 903 | 952 | 791 |
| - = No Data Reported; -- = Not Applicable; NA = Not Available; W = Withheld to avoid disclosure of individual company data. |
| Release Date: 3/29/2024 |
| Next Release Date: 8/30/2024 |