|
Download Data (XLS File) |
|
||||||||
|
||||||||
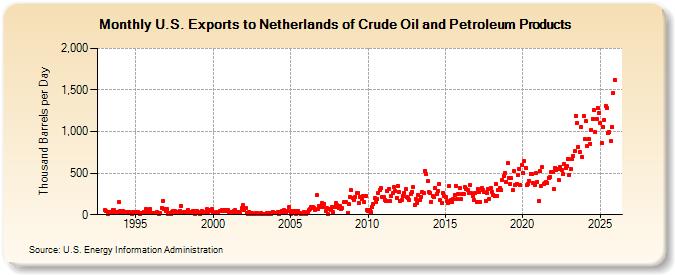
| U.S. Exports to Netherlands of Crude Oil and Petroleum Products (Thousand Barrels per Day) | ||||||||
| Year | Jan | Feb | Mar | Apr | May | Jun | Jul | Aug | Sep | Oct | Nov | Dec |
|---|---|---|---|---|---|---|---|---|---|---|---|---|
| 1993 | 51 | 39 | 14 | 27 | 36 | 30 | 57 | 51 | 25 | 32 | 24 | 151 |
| 1994 | 45 | 15 | 47 | 33 | 34 | 20 | 35 | 34 | 24 | 12 | 38 | 25 |
| 1995 | 30 | 28 | 35 | 5 | 22 | 23 | 36 | 15 | 68 | 34 | 32 | 67 |
| 1996 | 16 | 18 | 16 | 22 | 28 | 23 | 9 | 25 | 86 | 170 | 67 | 39 |
| 1997 | 65 | 9 | 15 | 12 | 34 | 42 | 47 | 37 | 38 | 38 | 48 | 105 |
| 1998 | 26 | 28 | 38 | 22 | 53 | 34 | 33 | 29 | 47 | 41 | 3 | 42 |
| 1999 | 35 | 21 | 12 | 46 | 31 | 20 | 32 | 65 | 28 | 54 | 45 | 64 |
| 2000 | 37 | 20 | 20 | 36 | 30 | 46 | 42 | 59 | 46 | 62 | 49 | 52 |
| 2001 | 21 | 28 | 36 | 23 | 47 | 53 | 38 | 27 | 37 | 37 | 82 | 112 |
| 2002 | 60 | 80 | 25 | 3 | 38 | 14 | 16 | 3 | 3 | 16 | 15 | 7 |
| 2003 | 11 | 26 | 3 | 14 | 6 | 3 | 22 | 5 | 24 | 6 | 37 | 24 |
| 2004 | 16 | 19 | 30 | 6 | 32 | 48 | 30 | 52 | 27 | 39 | 43 | 93 |
| 2005 | 14 | 48 | 28 | 42 | 10 | 26 | 42 | 25 | 14 | 10 | 29 | 16 |
| 2006 | 13 | 33 | 52 | 68 | 95 | 94 | 86 | 62 | 235 | 70 | 100 | 92 |
| 2007 | 142 | 91 | 134 | 41 | 76 | 6 | 72 | 52 | 90 | 32 | 91 | 141 |
| 2008 | 111 | 84 | 106 | 72 | 82 | 147 | 158 | 149 | 26 | 124 | 214 | 292 |
| 2009 | 203 | 172 | 217 | 261 | 260 | 145 | 207 | 187 | 224 | 152 | 226 | 55 |
| 2010 | 39 | 61 | 29 | 97 | 127 | 195 | 154 | 185 | 265 | 295 | 319 | 209 |
| 2011 | 212 | 180 | 167 | 287 | 312 | 163 | 227 | 256 | 331 | 286 | 204 | 348 |
| 2012 | 273 | 161 | 175 | 227 | 264 | 308 | 210 | 197 | 179 | 254 | 277 | 334 |
| 2013 | 118 | 185 | 143 | 237 | 172 | 218 | 269 | 261 | 527 | 488 | 402 | 269 |
| 2014 | 265 | 156 | 223 | 211 | 325 | 250 | 286 | 369 | 172 | 139 | 265 | 225 |
| 2015 | 208 | 166 | 145 | 343 | 174 | 151 | 184 | 239 | 349 | 187 | 254 | 317 |
| 2016 | 183 | 249 | 253 | 331 | 313 | 301 | 262 | 360 | 258 | 225 | 177 | 263 |
| 2017 | 155 | 306 | 268 | 152 | 320 | 292 | 269 | 167 | 261 | 312 | 194 | 322 |
| 2018 | 275 | 238 | 230 | 369 | 229 | 295 | 322 | 301 | 418 | 462 | 503 | 399 |
| 2019 | 620 | 442 | 372 | 440 | 294 | 525 | 355 | 373 | 478 | 553 | 360 | 595 |
| 2020 | 505 | 640 | 565 | 357 | 373 | 411 | 494 | 492 | 380 | 363 | 496 | 399 |
| 2021 | 159 | 522 | 341 | 568 | 374 | 378 | 395 | 382 | 442 | 458 | 515 | 511 |
| 2022 | 307 | 566 | 539 | 548 | 414 | 574 | 535 | 492 | 608 | 559 | 591 | 674 |
| 2023 | 602 | 516 | 925 | 767 | 748 | 1,174 | 1,147 | 714 | 781 | 1,063 | 761 | 1,134 |
| 2024 | 1,130 | |||||||||||
| - = No Data Reported; -- = Not Applicable; NA = Not Available; W = Withheld to avoid disclosure of individual company data. |
| Release Date: 3/29/2024 |
| Next Release Date: 4/30/2024 |