|
Download Data (XLS File) |
|
||||||||
|
||||||||
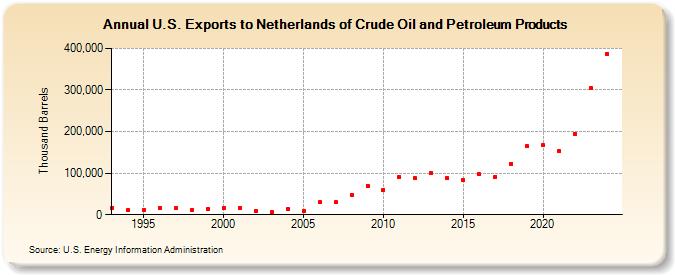
| U.S. Exports to Netherlands of Crude Oil and Petroleum Products (Thousand Barrels) | ||||||||
| Decade | Year-0 | Year-1 | Year-2 | Year-3 | Year-4 | Year-5 | Year-6 | Year-7 | Year-8 | Year-9 |
|---|---|---|---|---|---|---|---|---|---|---|
| 1990's | 16,431 | 11,052 | 12,058 | 15,847 | 15,058 | 12,047 | 13,834 | |||
| 2000's | 15,246 | 16,493 | 8,466 | 5,475 | 13,306 | 9,139 | 30,370 | 29,497 | 47,836 | 70,256 |
| 2010's | 60,131 | 90,695 | 87,339 | 100,013 | 88,118 | 82,651 | 96,835 | 91,760 | 123,041 | 164,484 |
| 2020's | 166,800 | 152,903 | 194,594 | 315,237 |
| - = No Data Reported; -- = Not Applicable; NA = Not Available; W = Withheld to avoid disclosure of individual company data. |
| Release Date: 3/29/2024 |
| Next Release Date: 8/30/2024 |