|
Download Data (XLS File) |
|
||||||||
|
||||||||
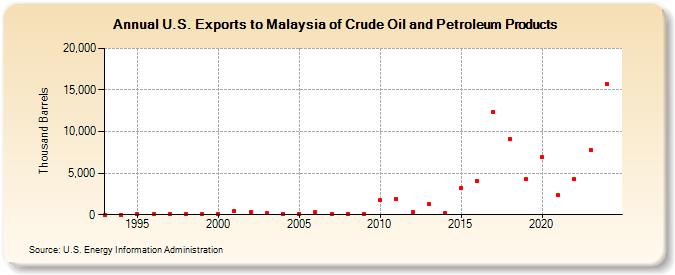
| U.S. Exports to Malaysia of Crude Oil and Petroleum Products (Thousand Barrels) | ||||||||
| Decade | Year-0 | Year-1 | Year-2 | Year-3 | Year-4 | Year-5 | Year-6 | Year-7 | Year-8 | Year-9 |
|---|---|---|---|---|---|---|---|---|---|---|
| 1990's | 23 | 19 | 42 | 47 | 70 | 64 | 46 | |||
| 2000's | 82 | 471 | 369 | 168 | 118 | 140 | 291 | 122 | 47 | 139 |
| 2010's | 1,734 | 1,935 | 282 | 1,267 | 237 | 3,184 | 4,054 | 12,397 | 9,126 | 4,285 |
| 2020's | 6,921 | 2,363 | 4,288 | 7,657 |
| - = No Data Reported; -- = Not Applicable; NA = Not Available; W = Withheld to avoid disclosure of individual company data. |
| Release Date: 3/29/2024 |
| Next Release Date: 8/30/2024 |