|
Download Data (XLS File) |
|
||||||||
|
||||||||
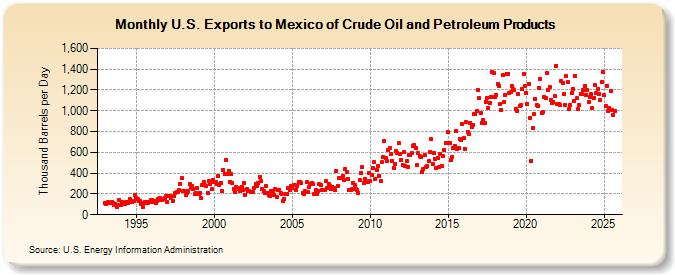
| U.S. Exports to Mexico of Crude Oil and Petroleum Products (Thousand Barrels per Day) | ||||||||
| Year | Jan | Feb | Mar | Apr | May | Jun | Jul | Aug | Sep | Oct | Nov | Dec |
|---|---|---|---|---|---|---|---|---|---|---|---|---|
| 1993 | 116 | 107 | 118 | 117 | 111 | 120 | 109 | 92 | 106 | 78 | 98 | 143 |
| 1994 | 89 | 119 | 113 | 100 | 122 | 123 | 117 | 147 | 118 | 120 | 131 | 190 |
| 1995 | 163 | 151 | 129 | 136 | 102 | 79 | 117 | 119 | 122 | 114 | 126 | 139 |
| 1996 | 138 | 125 | 128 | 116 | 136 | 152 | 156 | 140 | 143 | 151 | 160 | 176 |
| 1997 | 120 | 180 | 181 | 156 | 134 | 181 | 205 | 217 | 221 | 239 | 298 | 354 |
| 1998 | 231 | 228 | 188 | 208 | 231 | 292 | 259 | 274 | 251 | 196 | 208 | 257 |
| 1999 | 199 | 209 | 159 | 284 | 313 | 288 | 274 | 212 | 325 | 294 | 245 | 330 |
| 2000 | 314 | 316 | 295 | 368 | 288 | 309 | 232 | 430 | 392 | 528 | 395 | 424 |
| 2001 | 315 | 391 | 308 | 250 | 216 | 262 | 260 | 247 | 229 | 271 | 237 | 308 |
| 2002 | 192 | 250 | 227 | 231 | 217 | 218 | 214 | 258 | 297 | 274 | 308 | 366 |
| 2003 | 321 | 243 | 224 | 208 | 281 | 213 | 187 | 180 | 231 | 218 | 189 | 247 |
| 2004 | 173 | 234 | 238 | 207 | 204 | 131 | 151 | 203 | 202 | 255 | 233 | 274 |
| 2005 | 255 | 286 | 286 | 242 | 278 | 319 | 315 | 301 | 207 | 195 | 224 | 310 |
| 2006 | 214 | 267 | 293 | 307 | 293 | 200 | 234 | 198 | 230 | 297 | 288 | 238 |
| 2007 | 233 | 242 | 321 | 260 | 300 | 280 | 247 | 270 | 254 | 236 | 421 | 280 |
| 2008 | 357 | 350 | 356 | 374 | 338 | 443 | 408 | 343 | 241 | 233 | 243 | 309 |
| 2009 | 282 | 246 | 234 | 213 | 330 | 398 | 455 | 309 | 345 | 321 | 315 | 406 |
| 2010 | 320 | 381 | 449 | 505 | 348 | 434 | 467 | 373 | 327 | 505 | 552 | 708 |
| 2011 | 544 | 512 | 622 | 638 | 583 | 521 | 449 | 492 | 610 | 592 | 686 | 585 |
| 2012 | 531 | 480 | 605 | 464 | 514 | 460 | 574 | 574 | 590 | 664 | 670 | 646 |
| 2013 | 477 | 589 | 565 | 554 | 415 | 435 | 579 | 459 | 466 | 516 | 602 | 725 |
| 2014 | 492 | 595 | 539 | 450 | 549 | 455 | 582 | 469 | 567 | 626 | 690 | 690 |
| 2015 | 798 | 694 | 527 | 557 | 641 | 659 | 805 | 634 | 640 | 733 | 718 | 868 |
| 2016 | 737 | 633 | 891 | 791 | 773 | 887 | 848 | 863 | 970 | 967 | 994 | 1,199 |
| 2017 | 1,120 | 980 | 883 | 909 | 887 | 1,087 | 1,125 | 1,022 | 1,074 | 1,133 | 1,377 | 1,365 |
| 2018 | 1,137 | 1,154 | 1,261 | 1,238 | 1,067 | 1,008 | 1,343 | 1,088 | 1,153 | 1,358 | 1,354 | 1,169 |
| 2019 | 1,177 | 1,234 | 1,210 | 1,197 | 1,018 | 993 | 1,165 | 1,043 | 1,056 | 1,208 | 1,355 | 1,242 |
| 2020 | 1,171 | 1,067 | 1,262 | 935 | 521 | 835 | 966 | 1,114 | 1,053 | 1,045 | 1,223 | 1,308 |
| 2021 | 979 | 984 | 1,135 | 1,121 | 1,363 | 1,197 | 1,226 | 1,107 | 1,072 | 1,085 | 1,145 | 1,434 |
| 2022 | 1,062 | 1,067 | 1,054 | 1,289 | 1,270 | 1,161 | 1,059 | 1,332 | 1,276 | 1,018 | 1,060 | 1,169 |
| 2023 | 1,164 | 1,153 | 1,413 | 1,058 | 1,007 | 1,083 | 1,178 | 1,136 | 1,208 | 1,246 | 1,137 | 1,192 |
| 2024 | 1,086 | |||||||||||
| - = No Data Reported; -- = Not Applicable; NA = Not Available; W = Withheld to avoid disclosure of individual company data. |
| Release Date: 3/29/2024 |
| Next Release Date: 4/30/2024 |