|
Download Data (XLS File) |
|
||||||||
|
||||||||
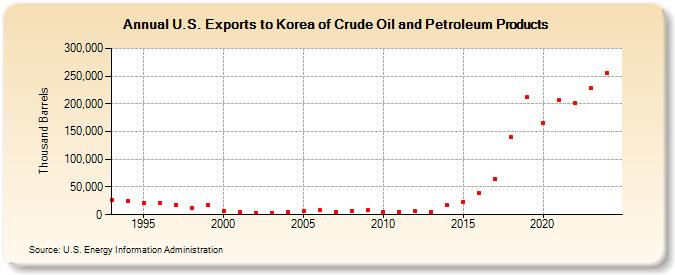
| U.S. Exports to Korea of Crude Oil and Petroleum Products (Thousand Barrels) | ||||||||
| Decade | Year-0 | Year-1 | Year-2 | Year-3 | Year-4 | Year-5 | Year-6 | Year-7 | Year-8 | Year-9 |
|---|---|---|---|---|---|---|---|---|---|---|
| 1990's | 27,017 | 24,001 | 20,959 | 21,859 | 18,250 | 11,868 | 17,735 | |||
| 2000's | 7,245 | 5,006 | 3,913 | 3,648 | 4,367 | 6,005 | 7,781 | 5,772 | 6,745 | 8,467 |
| 2010's | 4,721 | 5,397 | 5,992 | 4,885 | 16,889 | 23,621 | 39,385 | 64,099 | 139,276 | 211,526 |
| 2020's | 164,902 | 206,241 | 200,622 | 219,805 |
| - = No Data Reported; -- = Not Applicable; NA = Not Available; W = Withheld to avoid disclosure of individual company data. |
| Release Date: 3/29/2024 |
| Next Release Date: 8/30/2024 |