|
Download Data (XLS File) |
|
||||||||
|
||||||||
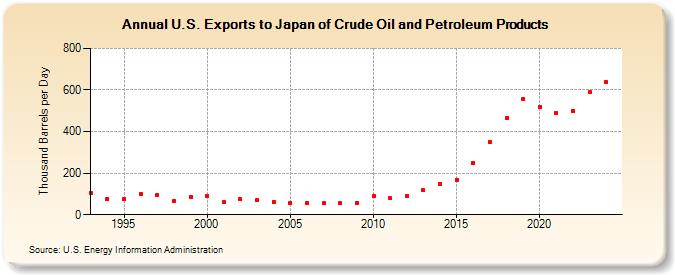
| U.S. Exports to Japan of Crude Oil and Petroleum Products (Thousand Barrels per Day) | ||||||||
| Decade | Year-0 | Year-1 | Year-2 | Year-3 | Year-4 | Year-5 | Year-6 | Year-7 | Year-8 | Year-9 |
|---|---|---|---|---|---|---|---|---|---|---|
| 1990's | 105 | 74 | 76 | 102 | 95 | 64 | 84 | |||
| 2000's | 90 | 62 | 74 | 69 | 63 | 56 | 58 | 54 | 54 | 58 |
| 2010's | 88 | 79 | 89 | 117 | 150 | 166 | 250 | 350 | 466 | 555 |
| 2020's | 519 | 488 | 501 | 621 |
| - = No Data Reported; -- = Not Applicable; NA = Not Available; W = Withheld to avoid disclosure of individual company data. |
| Release Date: 3/29/2024 |
| Next Release Date: 8/30/2024 |