|
Download Data (XLS File) |
|
||||||||
|
||||||||
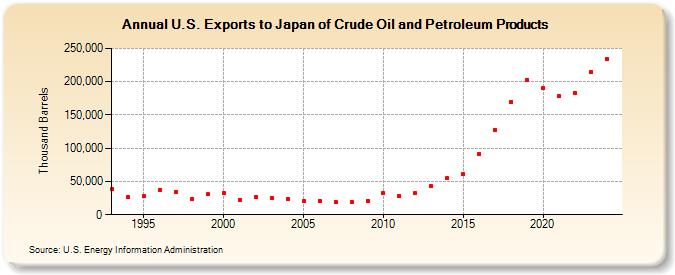
| U.S. Exports to Japan of Crude Oil and Petroleum Products (Thousand Barrels) | ||||||||
| Decade | Year-0 | Year-1 | Year-2 | Year-3 | Year-4 | Year-5 | Year-6 | Year-7 | Year-8 | Year-9 |
|---|---|---|---|---|---|---|---|---|---|---|
| 1990's | 38,476 | 26,836 | 27,745 | 37,479 | 34,825 | 23,417 | 30,810 | |||
| 2000's | 32,839 | 22,583 | 26,842 | 25,287 | 22,882 | 20,542 | 21,050 | 19,730 | 19,649 | 21,237 |
| 2010's | 32,263 | 28,846 | 32,581 | 42,843 | 54,682 | 60,622 | 91,581 | 127,593 | 170,128 | 202,496 |
| 2020's | 190,068 | 177,963 | 182,906 | 226,618 |
| - = No Data Reported; -- = Not Applicable; NA = Not Available; W = Withheld to avoid disclosure of individual company data. |
| Release Date: 3/29/2024 |
| Next Release Date: 8/30/2024 |