|
Download Data (XLS File) |
|
||||||||
|
||||||||
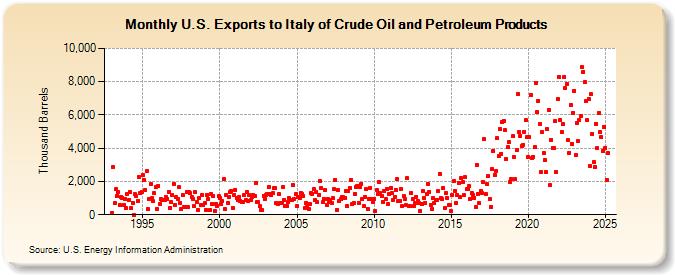
| U.S. Exports to Italy of Crude Oil and Petroleum Products (Thousand Barrels) | ||||||||
| Year | Jan | Feb | Mar | Apr | May | Jun | Jul | Aug | Sep | Oct | Nov | Dec |
|---|---|---|---|---|---|---|---|---|---|---|---|---|
| 1993 | 124 | 2,854 | 678 | 1,517 | 1,147 | 1,355 | 579 | 1,079 | 1,028 | 585 | 940 | 394 |
| 1994 | 1,273 | 897 | 1,392 | 380 | 722 | 5 | 1,219 | 1,120 | 828 | 2,280 | 1,319 | 1,392 |
| 1995 | 2,396 | 2,060 | 1,500 | 2,622 | 343 | 950 | 1,817 | 975 | 806 | 1,294 | 1,643 | 345 |
| 1996 | 1,728 | 643 | 935 | 857 | 857 | 896 | 1,080 | 970 | 1,393 | 414 | 736 | 1,177 |
| 1997 | 1,868 | 572 | 1,035 | 963 | 1,643 | 705 | 351 | 1,162 | 472 | 459 | 1,336 | 448 |
| 1998 | 1,342 | 1,289 | 1,078 | 950 | 521 | 1,340 | 788 | 281 | 1,004 | 603 | 1,197 | 581 |
| 1999 | 688 | 303 | 1,206 | 943 | 278 | 1,232 | 636 | 1,115 | 251 | 665 | 527 | 1,106 |
| 2000 | 994 | 643 | 827 | 2,154 | 328 | 1,169 | 732 | 1,078 | 1,357 | 1,430 | 422 | 1,188 |
| 2001 | 1,472 | 990 | 868 | 1,054 | 823 | 737 | 769 | 1,204 | 859 | 1,347 | 840 | 1,189 |
| 2002 | 883 | 1,059 | 1,168 | 1,099 | 1,903 | 743 | 764 | 500 | 307 | 260 | 1,148 | 921 |
| 2003 | 1,204 | 1,238 | 1,689 | 1,231 | 1,180 | 1,285 | 1,580 | 1,585 | 682 | 648 | 1,241 | 700 |
| 2004 | 725 | 1,691 | 901 | 521 | 525 | 760 | 986 | 913 | 876 | 1,757 | 930 | 1,217 |
| 2005 | 501 | 1,091 | 1,011 | 1,301 | 1,269 | 1,112 | 388 | 733 | 468 | 343 | 648 | 1,316 |
| 2006 | 1,251 | 1,540 | 874 | 1,379 | 745 | 1,198 | 2,000 | 1,611 | 744 | 971 | 1,457 | 573 |
| 2007 | 953 | 757 | 877 | 718 | 995 | 1,524 | 2,115 | 285 | 1,471 | 843 | 917 | 1,058 |
| 2008 | 1,042 | 1,016 | 1,435 | 505 | 1,432 | 1,580 | 2,106 | 618 | 695 | 1,232 | 1,644 | 1,746 |
| 2009 | 714 | 1,642 | 1,870 | 928 | 514 | 1,076 | 1,544 | 353 | 922 | 1,615 | 924 | 761 |
| 2010 | 931 | 198 | 1,461 | 1,264 | 1,987 | 1,294 | 1,098 | 785 | 1,416 | 937 | 1,539 | 633 |
| 2011 | 1,254 | 1,625 | 1,310 | 906 | 1,070 | 1,489 | 2,131 | 843 | 835 | 1,545 | 510 | 1,118 |
| 2012 | 925 | 558 | 2,184 | 542 | 506 | 1,319 | 928 | 544 | 712 | 1,082 | 841 | 703 |
| 2013 | 213 | 618 | 1,435 | 999 | 720 | 1,240 | 1,857 | 1,389 | 578 | 349 | 981 | 683 |
| 2014 | 890 | 887 | 1,398 | 2,468 | 1,004 | 958 | 1,621 | 394 | 1,314 | 1,026 | 577 | 603 |
| 2015 | 204 | 1,174 | 2,013 | 1,433 | 703 | 1,176 | 1,916 | 1,039 | 2,196 | 1,963 | 1,172 | 2,238 |
| 2016 | 1,516 | 1,541 | 1,720 | 960 | 1,297 | 1,211 | 1,025 | 441 | 3,007 | 1,275 | 675 | 1,419 |
| 2017 | 1,294 | 1,955 | 4,548 | 1,229 | 1,827 | 2,318 | 942 | 471 | 2,751 | 3,846 | 2,406 | 2,649 |
| 2018 | 4,588 | 3,511 | 5,156 | 3,667 | 5,555 | 5,661 | 5,069 | 3,353 | 4,042 | 4,381 | 1,989 | 2,133 |
| 2019 | 4,709 | 3,470 | 2,134 | 3,873 | 7,253 | 4,965 | 4,753 | 4,142 | 4,192 | 4,998 | 5,674 | 4,647 |
| 2020 | 3,488 | 4,669 | 7,191 | 3,425 | 3,469 | 4,065 | 7,935 | 6,172 | 6,860 | 5,434 | 2,544 | 4,951 |
| 2021 | 3,727 | 3,278 | 2,565 | 5,131 | 6,309 | 1,766 | 4,515 | 4,008 | 4,017 | 5,625 | 2,549 | 6,948 |
| 2022 | 8,283 | 5,699 | 4,958 | 5,438 | 8,287 | 7,593 | 7,885 | 4,468 | 3,728 | 6,610 | 4,277 | 6,124 |
| 2023 | 6,963 | 3,603 | 4,574 | 4,417 | 5,958 | 5,989 | 7,922 | 8,604 | 7,964 | 5,990 | 5,670 | 6,962 |
| 2024 | 2,933 | |||||||||||
| - = No Data Reported; -- = Not Applicable; NA = Not Available; W = Withheld to avoid disclosure of individual company data. |
| Release Date: 3/29/2024 |
| Next Release Date: 4/30/2024 |