|
Download Data (XLS File) |
|
||||||||
|
||||||||
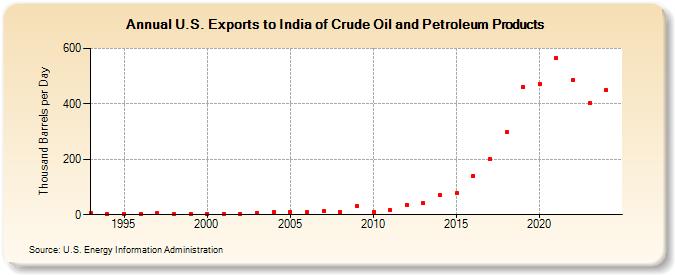
| U.S. Exports to India of Crude Oil and Petroleum Products (Thousand Barrels per Day) | ||||||||
| Decade | Year-0 | Year-1 | Year-2 | Year-3 | Year-4 | Year-5 | Year-6 | Year-7 | Year-8 | Year-9 |
|---|---|---|---|---|---|---|---|---|---|---|
| 1990's | 7 | 1 | 3 | 3 | 7 | 2 | 3 | |||
| 2000's | 3 | 3 | 3 | 7 | 11 | 11 | 8 | 14 | 10 | 30 |
| 2010's | 10 | 17 | 36 | 41 | 70 | 78 | 140 | 200 | 297 | 460 |
| 2020's | 471 | 566 | 486 | 395 |
| - = No Data Reported; -- = Not Applicable; NA = Not Available; W = Withheld to avoid disclosure of individual company data. |
| Release Date: 3/29/2024 |
| Next Release Date: 8/30/2024 |