|
Download Data (XLS File) |
|
||||||||
|
||||||||
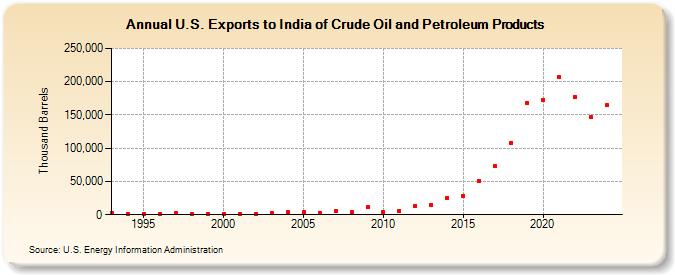
| U.S. Exports to India of Crude Oil and Petroleum Products (Thousand Barrels) | ||||||||
| Decade | Year-0 | Year-1 | Year-2 | Year-3 | Year-4 | Year-5 | Year-6 | Year-7 | Year-8 | Year-9 |
|---|---|---|---|---|---|---|---|---|---|---|
| 1990's | 2,603 | 413 | 1,151 | 1,099 | 2,602 | 818 | 1,202 | |||
| 2000's | 1,049 | 1,113 | 992 | 2,629 | 4,043 | 3,948 | 3,078 | 5,199 | 3,572 | 11,096 |
| 2010's | 3,675 | 6,139 | 13,352 | 15,004 | 25,532 | 28,448 | 51,279 | 72,954 | 108,532 | 168,006 |
| 2020's | 172,437 | 206,745 | 177,526 | 144,248 |
| - = No Data Reported; -- = Not Applicable; NA = Not Available; W = Withheld to avoid disclosure of individual company data. |
| Release Date: 6/28/2024 |
| Next Release Date: 8/30/2024 |