|
Download Data (XLS File) |
|
||||||||
|
||||||||
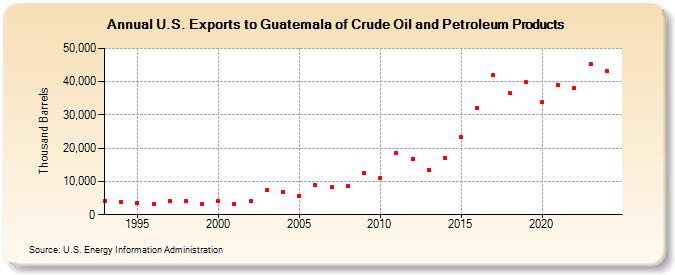
| U.S. Exports to Guatemala of Crude Oil and Petroleum Products (Thousand Barrels) | ||||||||
| Decade | Year-0 | Year-1 | Year-2 | Year-3 | Year-4 | Year-5 | Year-6 | Year-7 | Year-8 | Year-9 |
|---|---|---|---|---|---|---|---|---|---|---|
| 1990's | 4,164 | 3,931 | 3,573 | 3,149 | 4,204 | 4,052 | 3,131 | |||
| 2000's | 4,251 | 3,318 | 3,990 | 7,550 | 6,912 | 5,754 | 8,832 | 8,184 | 8,660 | 12,502 |
| 2010's | 11,086 | 18,546 | 16,800 | 13,558 | 17,127 | 23,226 | 32,105 | 42,080 | 36,444 | 39,755 |
| 2020's | 33,921 | 39,080 | 37,970 | 45,202 | 43,287 |
| - = No Data Reported; -- = Not Applicable; NA = Not Available; W = Withheld to avoid disclosure of individual company data. |
| Release Date: 6/30/2025 |
| Next Release Date: 8/29/2025 |