|
Download Data (XLS File) |
|
||||||||
|
||||||||
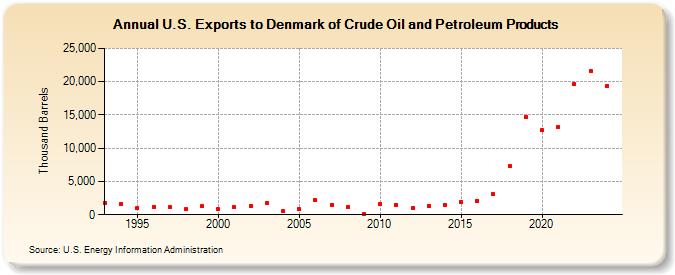
| U.S. Exports to Denmark of Crude Oil and Petroleum Products (Thousand Barrels) | ||||||||
| Decade | Year-0 | Year-1 | Year-2 | Year-3 | Year-4 | Year-5 | Year-6 | Year-7 | Year-8 | Year-9 |
|---|---|---|---|---|---|---|---|---|---|---|
| 1990's | 1,832 | 1,647 | 947 | 1,191 | 1,098 | 836 | 1,253 | |||
| 2000's | 824 | 1,132 | 1,343 | 1,806 | 495 | 818 | 2,143 | 1,523 | 1,125 | 145 |
| 2010's | 1,623 | 1,529 | 985 | 1,362 | 1,463 | 1,957 | 2,132 | 3,068 | 7,339 | 14,721 |
| 2020's | 12,695 | 13,168 | 19,645 | 22,306 |
| - = No Data Reported; -- = Not Applicable; NA = Not Available; W = Withheld to avoid disclosure of individual company data. |
| Release Date: 3/29/2024 |
| Next Release Date: 8/30/2024 |