|
Download Data (XLS File) |
|
||||||||
|
||||||||
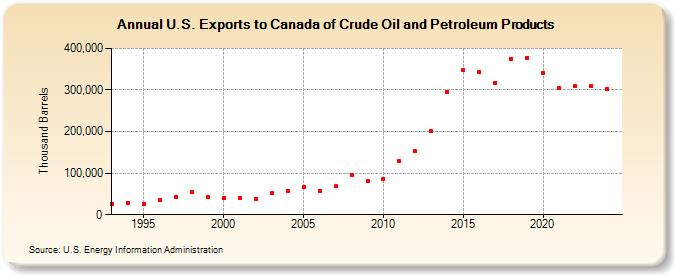
| U.S. Exports to Canada of Crude Oil and Petroleum Products (Thousand Barrels) | ||||||||
| Decade | Year-0 | Year-1 | Year-2 | Year-3 | Year-4 | Year-5 | Year-6 | Year-7 | Year-8 | Year-9 |
|---|---|---|---|---|---|---|---|---|---|---|
| 1990's | 26,234 | 28,613 | 26,503 | 34,287 | 43,551 | 53,898 | 43,358 | |||
| 2000's | 40,351 | 40,792 | 38,816 | 51,332 | 57,770 | 65,971 | 58,006 | 68,973 | 96,527 | 81,271 |
| 2010's | 85,163 | 128,274 | 152,312 | 200,271 | 295,365 | 348,703 | 342,236 | 317,930 | 373,588 | 377,951 |
| 2020's | 341,039 | 304,654 | 308,368 | 291,789 |
| - = No Data Reported; -- = Not Applicable; NA = Not Available; W = Withheld to avoid disclosure of individual company data. |
| Release Date: 3/29/2024 |
| Next Release Date: 8/30/2024 |