|
Download Data (XLS File) |
|
||||||||
|
||||||||
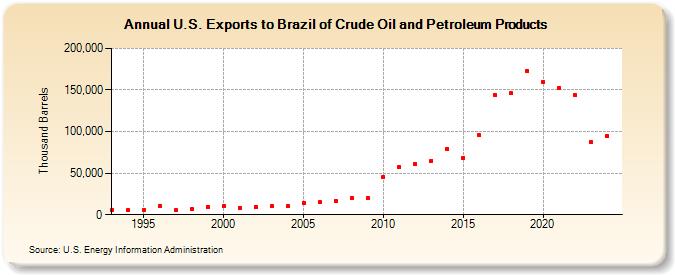
| U.S. Exports to Brazil of Crude Oil and Petroleum Products (Thousand Barrels) | ||||||||
| Decade | Year-0 | Year-1 | Year-2 | Year-3 | Year-4 | Year-5 | Year-6 | Year-7 | Year-8 | Year-9 |
|---|---|---|---|---|---|---|---|---|---|---|
| 1990's | 5,820 | 5,375 | 5,745 | 10,717 | 5,623 | 6,408 | 9,721 | |||
| 2000's | 10,195 | 8,459 | 9,499 | 9,902 | 9,941 | 14,280 | 15,264 | 16,937 | 19,924 | 19,989 |
| 2010's | 45,058 | 57,231 | 60,680 | 65,186 | 79,235 | 68,505 | 95,320 | 144,244 | 145,856 | 172,974 |
| 2020's | 160,127 | 152,665 | 143,928 | 87,539 |
| - = No Data Reported; -- = Not Applicable; NA = Not Available; W = Withheld to avoid disclosure of individual company data. |
| Release Date: 6/28/2024 |
| Next Release Date: 8/30/2024 |