|
Download Data (XLS File) |
|
||||||||
|
||||||||
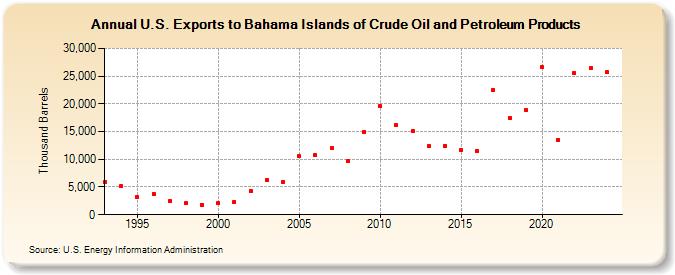
| U.S. Exports to Bahama Islands of Crude Oil and Petroleum Products (Thousand Barrels) | ||||||||
| Decade | Year-0 | Year-1 | Year-2 | Year-3 | Year-4 | Year-5 | Year-6 | Year-7 | Year-8 | Year-9 |
|---|---|---|---|---|---|---|---|---|---|---|
| 1990's | 5,860 | 5,119 | 3,127 | 3,816 | 2,423 | 2,041 | 1,842 | |||
| 2000's | 2,063 | 2,381 | 4,250 | 6,240 | 5,831 | 10,522 | 10,694 | 11,946 | 9,732 | 14,878 |
| 2010's | 19,582 | 16,125 | 15,113 | 12,335 | 12,421 | 11,645 | 11,474 | 22,503 | 17,478 | 18,925 |
| 2020's | 26,563 | 13,489 | 25,603 | 26,399 |
| - = No Data Reported; -- = Not Applicable; NA = Not Available; W = Withheld to avoid disclosure of individual company data. |
| Release Date: 8/30/2024 |
| Next Release Date: 8/29/2025 |