|
Download Data (XLS File) |
|
||||||||
|
||||||||
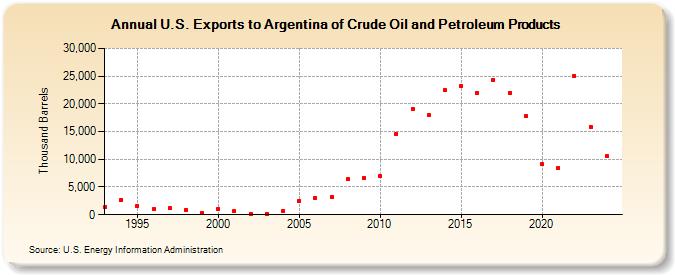
| U.S. Exports to Argentina of Crude Oil and Petroleum Products (Thousand Barrels) | ||||||||
| Decade | Year-0 | Year-1 | Year-2 | Year-3 | Year-4 | Year-5 | Year-6 | Year-7 | Year-8 | Year-9 |
|---|---|---|---|---|---|---|---|---|---|---|
| 1990's | 1,349 | 2,724 | 1,628 | 1,037 | 1,206 | 914 | 369 | |||
| 2000's | 1,040 | 604 | 193 | 168 | 759 | 2,490 | 2,995 | 3,208 | 6,431 | 6,600 |
| 2010's | 6,951 | 14,632 | 19,097 | 18,027 | 22,407 | 23,231 | 22,023 | 24,320 | 22,034 | 17,804 |
| 2020's | 9,190 | 8,492 | 25,080 | 16,839 |
| - = No Data Reported; -- = Not Applicable; NA = Not Available; W = Withheld to avoid disclosure of individual company data. |
| Release Date: 3/29/2024 |
| Next Release Date: 8/30/2024 |