|
Download Data (XLS File) |
|
||||||||
|
||||||||
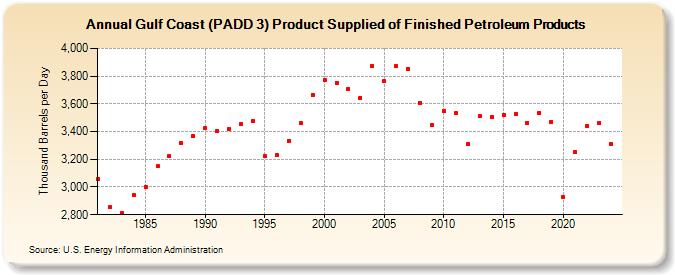
| Gulf Coast (PADD 3) Product Supplied of Finished Petroleum Products (Thousand Barrels per Day) | ||||||||
| Decade | Year-0 | Year-1 | Year-2 | Year-3 | Year-4 | Year-5 | Year-6 | Year-7 | Year-8 | Year-9 |
|---|---|---|---|---|---|---|---|---|---|---|
| 1980's | 3,055 | 2,855 | 2,814 | 2,939 | 3,003 | 3,148 | 3,223 | 3,316 | 3,368 | |
| 1990's | 3,426 | 3,407 | 3,418 | 3,451 | 3,477 | 3,227 | 3,229 | 3,334 | 3,463 | 3,667 |
| 2000's | 3,772 | 3,753 | 3,709 | 3,645 | 3,875 | 3,764 | 3,870 | 3,852 | 3,609 | 3,450 |
| 2010's | 3,551 | 3,534 | 3,311 | 3,511 | 3,505 | 3,521 | 3,529 | 3,465 | 3,537 | 3,472 |
| 2020's | 2,928 | 3,256 | 3,441 | 3,465 |
| - = No Data Reported; -- = Not Applicable; NA = Not Available; W = Withheld to avoid disclosure of individual company data. |
| Release Date: 8/30/2024 |
| Next Release Date: 8/29/2025 |