|
Download Data (XLS File) |
|
||||||||
|
||||||||
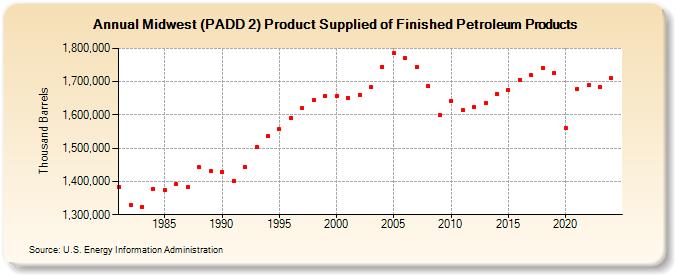
| Midwest (PADD 2) Product Supplied of Finished Petroleum Products (Thousand Barrels) | ||||||||
| Decade | Year-0 | Year-1 | Year-2 | Year-3 | Year-4 | Year-5 | Year-6 | Year-7 | Year-8 | Year-9 |
|---|---|---|---|---|---|---|---|---|---|---|
| 1980's | 1,381,945 | 1,329,410 | 1,324,078 | 1,376,771 | 1,373,406 | 1,391,538 | 1,384,167 | 1,442,451 | 1,431,496 | |
| 1990's | 1,429,636 | 1,400,801 | 1,443,477 | 1,502,496 | 1,537,102 | 1,556,902 | 1,590,346 | 1,619,365 | 1,644,216 | 1,656,156 |
| 2000's | 1,656,895 | 1,652,044 | 1,661,370 | 1,683,548 | 1,745,010 | 1,785,613 | 1,769,637 | 1,744,468 | 1,685,447 | 1,599,338 |
| 2010's | 1,643,263 | 1,613,696 | 1,623,423 | 1,635,137 | 1,664,108 | 1,675,382 | 1,705,873 | 1,718,779 | 1,741,938 | 1,726,749 |
| 2020's | 1,561,445 | 1,679,177 | 1,689,891 | 1,683,053 |
| - = No Data Reported; -- = Not Applicable; NA = Not Available; W = Withheld to avoid disclosure of individual company data. |
| Release Date: 3/29/2024 |
| Next Release Date: 8/30/2024 |