|
Download Data (XLS File) |
|
||||||||
|
||||||||
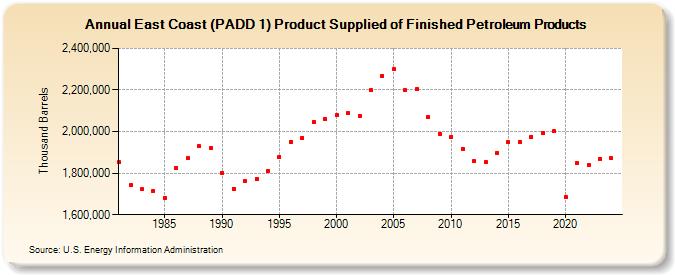
| East Coast (PADD 1) Product Supplied of Finished Petroleum Products (Thousand Barrels) | ||||||||
| Decade | Year-0 | Year-1 | Year-2 | Year-3 | Year-4 | Year-5 | Year-6 | Year-7 | Year-8 | Year-9 |
|---|---|---|---|---|---|---|---|---|---|---|
| 1980's | 1,851,933 | 1,741,869 | 1,721,952 | 1,713,785 | 1,682,710 | 1,826,266 | 1,870,630 | 1,928,194 | 1,921,409 | |
| 1990's | 1,799,859 | 1,725,083 | 1,760,546 | 1,771,745 | 1,810,602 | 1,878,148 | 1,952,075 | 1,970,449 | 2,047,864 | 2,062,623 |
| 2000's | 2,078,964 | 2,088,136 | 2,075,643 | 2,198,691 | 2,267,877 | 2,298,767 | 2,197,769 | 2,205,440 | 2,069,848 | 1,989,293 |
| 2010's | 1,975,091 | 1,917,814 | 1,856,190 | 1,853,251 | 1,897,309 | 1,948,341 | 1,950,413 | 1,975,660 | 1,994,358 | 2,000,603 |
| 2020's | 1,684,669 | 1,847,862 | 1,839,963 | 1,869,183 | 1,870,839 |
| - = No Data Reported; -- = Not Applicable; NA = Not Available; W = Withheld to avoid disclosure of individual company data. |
| Release Date: 6/30/2025 |
| Next Release Date: 8/29/2025 |